
This is a disclaimer:
Using the notes below is dangerous for both your sanity and peace of mind.
If you still want to read them beware of the fact that they may be "not even wrong".

Everything I write in there is just a mnemonic device to give me a chance to
fix things I badly broke because I'm bloody stupid and think I can tinker with stuff
that is way above my head and go away with it. It reminds me of Gandalf's warning:
"Perilous to all of us are the devices of an art deeper than we ourselves possess."

Moreover, a lot of it I blatantly stole on the net from other obviously cleverer
persons than me -- not very hard. Forgive me. My bad.

Please consider it and go away. You have been warned!
(:toc:)
Server Setup
A simple introduction to NRPE (Nagios Remote Plugin Executor) can be viewed in this (pdf) document: https://www.bic.mni.mcgill.ca/uploads/PersonalMalouinjeanfrancois/nrpe-howto.pdf
Install nagios3 and the nrpe stuff (nagios2) on a web server:
matsya:~# dpkg -l \*nagios\* | grep ^i
ii  nagios-images                    0.7                          Collection of images and icons for the nagios system
ii  nagios-nrpe-plugin               2.12-4                       Nagios Remote Plugin Executor Plugin
ii  nagios-nrpe-server               2.12-4                       Nagios Remote Plugin Executor Server
ii  nagios-plugins                   1.4.15-3squeeze1             Plugins for the nagios network monitoring and management system
ii  nagios-plugins-basic             1.4.15-3squeeze1             Plugins for the nagios network monitoring and management system
ii  nagios-plugins-standard          1.4.15-3squeeze1             Plugins for the nagios network monitoring and management system
ii  nagios3                          3.2.1-2                      A host/service/network monitoring and management system
ii  nagios3-cgi                      3.2.1-2                      cgi files for nagios3
ii  nagios3-common                   3.2.1-2                      support files for nagios3
ii  nagios3-core                     3.2.1-2                      A host/service/network monitoring and management system core files
ii  nagios3-doc                      3.2.1-2                      documentation for nagios3
The nagios server is a complicated beast but the defaults in the Debian pre-compiled package seem to do the deed. The nagios3 config file is located in /etc/nagios3/nagios.cfg and removing all comments should look like this:
log_file=/var/log/nagios3/nagios.log
cfg_file=/etc/nagios3/commands.cfg
cfg_dir=/etc/nagios-plugins/config
cfg_dir=/etc/nagios3/conf.d
object_cache_file=/var/cache/nagios3/objects.cache
precached_object_file=/var/lib/nagios3/objects.precache
resource_file=/etc/nagios3/resource.cfg
status_file=/var/cache/nagios3/status.dat
status_update_interval=10
nagios_user=nagios
nagios_group=nagios
check_external_commands=1
command_check_interval=30s
command_file=/var/lib/nagios3/rw/nagios.cmd
external_command_buffer_slots=4096
lock_file=/var/run/nagios3/nagios3.pid
temp_file=/var/cache/nagios3/nagios.tmp
temp_path=/tmp
event_broker_options=-1
log_rotation_method=d
log_archive_path=/var/log/nagios3/archives
use_syslog=1
log_notifications=1
log_service_retries=1
log_host_retries=1
log_event_handlers=1
log_initial_states=0
log_external_commands=1
log_passive_checks=1
service_inter_check_delay_method=s
max_service_check_spread=30
service_interleave_factor=s
host_inter_check_delay_method=s
max_host_check_spread=30
max_concurrent_checks=0
check_result_reaper_frequency=10
max_check_result_reaper_time=30
check_result_path=/var/lib/nagios3/spool/checkresults
max_check_result_file_age=3600
cached_host_check_horizon=15
cached_service_check_horizon=15
enable_predictive_host_dependency_checks=1
enable_predictive_service_dependency_checks=1
soft_state_dependencies=0
auto_reschedule_checks=0
auto_rescheduling_interval=30
auto_rescheduling_window=180
sleep_time=0.25
#/JF!/ 20120131.-# The service_check_timeout needs to be bumped.
#/JF!/ 20120131.-# A service that exceeds this limit will be killed
#/JF!/ 20120131.-# and a CRITICAL state will be returned with an error:
#/JF!/ 20120131.-# 'Service Check Timed Out'
#/JF!/ 20120131.-# service_check_timeout=60
service_check_timeout=140
host_check_timeout=30
event_handler_timeout=30
notification_timeout=30
ocsp_timeout=5
perfdata_timeout=5
retain_state_information=1
state_retention_file=/var/lib/nagios3/retention.dat
retention_update_interval=60
use_retained_program_state=1
use_retained_scheduling_info=1
retained_host_attribute_mask=0
retained_service_attribute_mask=0
retained_process_host_attribute_mask=0
retained_process_service_attribute_mask=0
retained_contact_host_attribute_mask=0
retained_contact_service_attribute_mask=0
interval_length=60
check_for_updates=0
bare_update_check=1
use_aggressive_host_checking=0
execute_service_checks=1
accept_passive_service_checks=1
execute_host_checks=1
accept_passive_host_checks=1
enable_notifications=1
enable_event_handlers=1
process_performance_data=0
obsess_over_services=0
obsess_over_hosts=0
translate_passive_host_checks=0
passive_host_checks_are_soft=0
check_for_orphaned_services=1
check_for_orphaned_hosts=1
check_service_freshness=1
service_freshness_check_interval=60
check_host_freshness=0
host_freshness_check_interval=60
additional_freshness_latency=15
enable_flap_detection=1
low_service_flap_threshold=5.0
high_service_flap_threshold=20.0
low_host_flap_threshold=5.0
high_host_flap_threshold=20.0
date_format=iso8601
p1_file=/usr/lib/nagios3/p1.pl
enable_embedded_perl=1
use_embedded_perl_implicitly=1
illegal_object_name_chars=`~!$%^&*|'"<>?,()=
illegal_macro_output_chars=`~$&|'"<>
use_regexp_matching=0
use_true_regexp_matching=0
admin_email=root@localhost
admin_pager=pageroot@localhost
daemon_dumps_core=0
use_large_installation_tweaks=0
enable_environment_macros=1
debug_level=0
debug_verbosity=1
debug_file=/var/log/nagios3/nagios.debug
max_debug_file_size=1000000
A few notes about this config: check_external_commands=1 is on, so external command through the CGI web interface are enabled (they are not by default for security reasons). For this to work on Debian one needs to modify the ownerships and permissions of the named pipe used for communicating with nagios:
~# /etc/init.d/nagios3 stop
~# dpkg-statoverride --update --add nagios www-data 2710 /var/lib/nagios3/rw
~# dpkg-statoverride --update --add nagios nagios 751 /var/lib/nagios3
~# /etc/init.d/nagios3 start
Nagios config files modifications
The next section shows the BIC local modifications to Nagios. It is very important to first verify that the syntax is valid upon making a change to any config file used by Nagios. Nagios will refuse to start if it detects config errors.
An example of a valid config check:
~# nagios3 -v /etc/nagios3/nagios.cfg

Nagios Core 3.2.1
Copyright (c) 2009-2010 Nagios Core Development Team and Community Contributors
Copyright (c) 1999-2009 Ethan Galstad
Last Modified: 03-09-2010
License: GPL

Website: https://www.nagios.org
Reading configuration data...
   Read main config file okay...
Processing object config file '/etc/nagios3/commands.cfg'...
Processing object config directory '/etc/nagios-plugins/config'...
Processing object config file '/etc/nagios-plugins/config/games.cfg'...
Processing object config file '/etc/nagios-plugins/config/ifstatus.cfg'...
Processing object config file '/etc/nagios-plugins/config/ldap.cfg'...

[...%<...%<...]

Processing object config directory '/etc/nagios3/conf.d'...
Processing object config file '/etc/nagios3/conf.d/localhost_nagios2.cfg'...
Processing object config file '/etc/nagios3/conf.d/services_nagios2.cfg'...
Processing object config file '/etc/nagios3/conf.d/BIC-passive-services.cfg'...
Processing object config file '/etc/nagios3/conf.d/contacts_nagios2.cfg'...
Processing object config file '/etc/nagios3/conf.d/hostgroups_nagios2.cfg'...
Processing object config file '/etc/nagios3/conf.d/BIC-services.cfg'...
Processing object config file '/etc/nagios3/conf.d/generic-service_nagios2.cfg'...
Processing object config file '/etc/nagios3/conf.d/BIC-hostgroups.cfg'...
Processing object config file '/etc/nagios3/conf.d/timeperiods_nagios2.cfg'...
Processing object config file '/etc/nagios3/conf.d/extinfo_nagios2.cfg'...
Processing object config file '/etc/nagios3/conf.d/BIC-commands.cfg'...
Processing object config file '/etc/nagios3/conf.d/BIC-hosts.cfg'...
Processing object config file '/etc/nagios3/conf.d/BIC-contacts.cfg'...
Processing object config file '/etc/nagios3/conf.d/generic-host_nagios2.cfg'...
   Read object config files okay...

Running pre-flight check on configuration data...

Checking services...
        Checked 141 services.
Checking hosts...
        Checked 24 hosts.
Checking host groups...
        Checked 13 host groups.
Checking service groups...
        Checked 0 service groups.
Checking contacts...
        Checked 4 contacts.
Checking contact groups...
        Checked 3 contact groups.
Checking service escalations...
        Checked 0 service escalations.
Checking service dependencies...
        Checked 0 service dependencies.
Checking host escalations...
        Checked 0 host escalations.
Checking host dependencies...
        Checked 0 host dependencies.
Checking commands...
        Checked 164 commands.
Checking time periods...
        Checked 4 time periods.
Checking for circular paths between hosts...
Checking for circular host and service dependencies...
Checking global event handlers...
Checking obsessive compulsive processor commands...
Checking misc settings...

Total Warnings: 0
Total Errors:   0

Things look okay - No serious problems were detected during the pre-flight check
If they are no errors reported, reload Nagios:
/etc/init.d/nagios3 reload
BIC local stuff
The Nagios BIC specific stuff is located on a web server (a Debian/Squeeze Xen virtual machine matsya.bic.mni.mcgill.ca) in the directory /etc/nagios3/conf.d as specified by cfg_dir=/etc/nagios3/conf.d on the server.
matsya:~# ls -la /etc/nagios3/conf.d/
total 172
drwxr-xr-x 2 root root  4096 Sep  4 11:14 ./
drwxr-xr-x 4 root root  4096 Mar  6  2013 ../
-rw-r--r-- 1 root root  2067 Jul 23 16:04 BIC-commands.cfg
-rw-r--r-- 1 root root  3060 Dec 14  2012 BIC-contacts.cfg
-rw-r--r-- 1 root root  3599 Mar  5  2013 BIC-generic-host.cfg
-rw-r--r-- 1 root root  3696 Dec 14  2012 BIC-generic-service.cfg
-rw-r--r-- 1 root root  4618 Mar  3  2013 BIC-hostgroups.cfg
-rw-r--r-- 1 root root 25218 Apr 30 21:31 BIC-hosts.cfg
-rw-r--r-- 1 root root  6107 Mar  5  2013 BIC-hosts-meglab.cfg
-rw-r--r-- 1 root root  1722 Jun  5 12:21 BIC-passive-services.cfg
-rw-r--r-- 1 root root 16443 Jan 31  2013 BIC-service-dependencies.cfg
-rw-r--r-- 1 root root 45162 Sep  4 11:14 BIC-services.cfg
-rw-r--r-- 1 root root  1695 Jul  3  2010 contacts_nagios2.cfg
-rw-r--r-- 1 root root   418 Jul  3  2010 extinfo_nagios2.cfg
-rw-r--r-- 1 root root  1152 Jul  3  2010 generic-host_nagios2.cfg
-rw-r--r-- 1 root root  1862 Feb  9  2012 generic-service_nagios2.cfg
-rw-r--r-- 1 root root   698 Oct 27  2011 hostgroups_nagios2.cfg
-rw-r--r-- 1 root root  2220 Nov  8  2011 localhost_nagios2.cfg
-rw-r--r-- 1 root root   662 Dec 16  2012 services_nagios2.cfg
-rw-r--r-- 1 root root  1609 Jul  3  2010 timeperiods_nagios2.cfg
The BIC-specific files all start with BIC-*. Somehow services_nagios2.cfg has been modified but I never got around at renaming it. Oh well, one day.
The file /etc/nagios3/conf.d/BIC-commands.cfg contains commands definitions refered to in the other BIC-specific files. See below.
~# cat /etc/nagios3/conf.d/BIC-commands.cfg

# this command runs a program $ARG1$ with up to 6 arguments $ARGX$
define command{
   command_name    check_me
   command_line    /usr/lib/nagios/plugins/check_nrpe -H $HOSTADDRESS$ -c $ARG1$ -a $ARG2$ $ARG3$ $ARG4$ $ARG5$ $ARG6$ $ARG7$
}

define command{
    command_name    check_temperature
    command_line    /usr/lib/nagios/plugins/check_nrpe -H $HOSTADDRESS$ -c check_digitemp -a $ARG1$ $ARG2$ $ARG3$ $ARG4$
}

define command{
    command_name    check_httpssl
    command_line    /usr/lib/nagios/plugins/check_http -S -H $HOSTADDRESS$
}

define command{
    command_name    check_linux_raid
    command_line    /usr/lib/nagios/plugins/check_linux_raid '$ARG1$'
}

define command{
    command_name    check_all_md
    command_line    /usr/lib/nagios/plugins/check_nrpe -H $HOSTADDRESS$ -c check_linux_raid
}
/etc/nagios3/conf.d/BIC-contacts.cfg contains the contact information on who should be notified of what, under which conditions and by what means (email, pager, SMS, etc). The notify-service-by-email and notify-host-by-email commands are defined in the Nagios /etc/nagios3/commands.cfg.
~# cat /etc/nagios3/conf.d/BIC-contacts.cfg

define contact{
        contact_name                    malin
        alias                           malin
        service_notification_period     24x7
        host_notification_period        24x7
        service_notification_options    w,u,c,r
        host_notification_options       d,u,r
        service_notification_commands   notify-service-by-email
        host_notification_commands      notify-host-by-email
        email                           malin@bic.mni.mcgill.ca
        }

define contact{
        contact_name                    malin-txt
        alias                           malin-txt
        service_notification_period     24x7
        host_notification_period        24x7
        service_notification_options    w,u,c,r
        host_notification_options       d,u,r
        service_notification_commands   notify-service-by-email
        host_notification_commands      notify-host-by-email
        email                           5142311753@txt.bell.ca
        }

define contact{
        contact_name                    sylvain
        alias                           sylvain
        service_notification_period     24x7
        host_notification_period        24x7
        service_notification_options    w,u,c,r
        host_notification_options       d,u,r
        service_notification_commands   notify-service-by-email
        host_notification_commands      notify-host-by-email
        email                           sylvain@bic.mni.mcgill.ca
        }
###############################################################################
###############################################################################
#
# CONTACT GROUPS
#
###############################################################################
###############################################################################

# We only have one contact in this simple configuration file, so there is
# no need to create more than one contact group.

define contactgroup{
        contactgroup_name       bicadmin
        alias                   Nagios Administrators
        members                 malin,sylvain
        }

define contactgroup{
        contactgroup_name       texters
        alias                   Nagios Administrators with Text
        members                 malin-txt
        }
~# cat /etc/nagios3/conf.d/BIC-services.cfg
define service{
        use                     generic-service
        hostgroup_name          mirror-servers
        service_description     Mirror /raid/mirror
        check_command           check_me!check_disk!10%!5%!/raid/mirror
}

define service{
        use                     generic-service
        hostgroup_name          amanda-servers
        service_description     Holddisk /holddisk
        check_command           check_me!check_disk!10%!1%!/holddisk
}

define service{
        use                     generic-service
        hostgroup_name          amanda-servers
        service_description     Partition /opt
        check_command           check_me!check_disk!20%!10%!/opt
}

# check that ntp-only hosts are up
define service {
        use                      generic-service
        hostgroup_name           ntp-servers
        service_description      PING
        check_command            check_ping!100.0,20%!500.0,60%
        notification_interval    0 ; set > 0 if you want to be renotified
}

# check that dns-only hosts are up
define service {
        use                      generic-service
        hostgroup_name           dns-servers
        service_description      PING
        check_command            check_ping!100.0,20%!500.0,60%
        notification_interval    0 ; set > 0 if you want to be renotified
}

# check that xen-servers hosts are up
define service {
        use                      generic-service
        hostgroup_name           xen-servers
        service_description      PING
        check_command            check_ping!100.0,20%!500.0,60%
        notification_interval    u,d,r
}
~# cat /etc/nagios3/conf.d/BIC-hostgroups.cfg

define hostgroup {
        hostgroup_name  debian-servers
        alias           Debian GNU/Linux Servers
        members         cassio.bic.mni.mcgill.ca,\
                        curtis.bic.mni.mcgill.ca,\
                        escalus.bic.mni.mcgill.ca,\
                        feeble.bic.mni.mcgill.ca,\
                        gaspar.bic.mni.mcgill.ca,\
                        gertrude.bic.mni.mcgill.ca,\
                        gloria.bic.mni.mcgill.ca,\
                        grumio.bic.mni.mcgill.ca,\
                        grumpy.bic.mni.mcgill.ca,\
                        gustav.bic.mni.mcgill.ca,\
                        helena.bic.mni.mcgill.ca,\
                        lorax.bic.mni.mcgill.ca,\
                        noodles.bic.mni.mcgill.ca,\
                        puck.bic.mni.mcgill.ca,\
                        shadow.bic.mni.mcgill.ca,\
                        tullus.bic.mni.mcgill.ca,\
                        tutor.bic.mni.mcgill.ca,\
                        wart.bic.mni.mcgill.ca,\
                        watch.bic.mni.mcgill.ca
        }

define hostgroup {
        hostgroup_name  http-servers
        alias           HTTP servers
        members         noodles.bic.mni.mcgill.ca,\
                        feeble.bic.mni.mcgill.ca
        }

define hostgroup {
        hostgroup_name  ssh-servers
        alias           SSH servers
        members         cassio.bic.mni.mcgill.ca
        }

# nagios doesn't like monitoring hosts without services, so this is
# a group for devices that have no other "services" monitorable
# (like routers w/out snmp for example)
define hostgroup {
        hostgroup_name  ping-servers
        alias           Pingable servers
        members         gateway
        }

define hostgroup {
        hostgroup_name bic-servers
        alias           DISKS servers
        members         gaspar.bic.mni.mcgill.ca,\
                        gloria.bic.mni.mcgill.ca,\
                        grumio.bic.mni.mcgill.ca,\
                        gustav.bic.mni.mcgill.ca,\
                        tullus.bic.mni.mcgill.ca,\
                        tutor.bic.mni.mcgill.ca
}

define hostgroup {
        hostgroup_name mirror-servers
        alias           MIRROR servers
        members         gaspar.bic.mni.mcgill.ca,\
                        gertrude.bic.mni.mcgill.ca,\
                        gloria.bic.mni.mcgill.ca,\
                        grumio.bic.mni.mcgill.ca,\
                        grumpy.bic.mni.mcgill.ca,\
                        gustav.bic.mni.mcgill.ca
}

define hostgroup {
        hostgroup_name ntp-servers
        alias           NTP servers
        members         escalus.bic.mni.mcgill.ca,\
                        lorax.bic.mni.mcgill.ca,\
                        feeble.bic.mni.mcgill.ca
}

define hostgroup {
        hostgroup_name dns-servers
        alias           DNS servers
        members         shadow.bic.mni.mcgill.ca,\
                        grumio.bic.mni.mcgill.ca
}

define hostgroup {
        hostgroup_name  amanda-servers
        alias           AMANDA servers
        members         gaspar.bic.mni.mcgill.ca,\
                        gertrude.bic.mni.mcgill.ca,\
                        wart.bic.mni.mcgill.ca,\
                        watch.bic.mni.mcgill.ca
}

define hostgroup {
        hostgroup_name  xen-servers
        alias           XEN servers
        members         helena.bic.mni.mcgill.ca,\
                        puck.bic.mni.mcgill.ca
}
This is just an example for one host. It allows Nagios to check if the host is alive. It will also check and send notifications if the system disk is too full, if there are too many processes or if the load average is too high. Be creative! Stuff as many as you want!
notification_options: This directive is used to determine when notifications for the host should be sent out. Valid options are a combination of one or more of the following: d = send notifications on a DOWN state, u = send notifications on an UNREACHABLE state, r = send notifications on recoveries (OK state), f = send notifications when the host starts and stops flapping, and s = send notifications when scheduled downtime starts and ends. If you specify n (none) as an option, no host notifications will be sent out. If you do not specify any notification options, Nagios will assume that you want notifications to be sent out for all possible states. Example: If you specify d,r in this field, notifications will only be sent out when the host goes DOWN and when it recovers from a DOWN state.
/etc/nagios3/conf.d/BIC-hosts.cfg is a fairly large file, containing all the services NAGIOS will monitor for all the Nagios nodes.
~# cat /etc/nagios3/conf.d/BIC-hosts.cfg

########################################################################
### watch
########################################################################
define host{
        use                     generic-host
        host_name               watch.bic.mni.mcgill.ca
        alias                   watch
        address                 132.206.178.101
        check_command           check-host-alive
        max_check_attempts      20
        notification_interval   240
        notification_period     24x7
        notification_options    d,u,r
        }

# Define a service to check the system disk space of the root partition.
# Warning if < 20% free, critical if # < 10% free space on partition.

define service{
        use                     generic-service
        host_name               watch.bic.mni.mcgill.ca
        service_description     Partition /root
        check_command           check_me!check_disk!20%!10%!/
        }

define service{
        use                     generic-service
        host_name               watch.bic.mni.mcgill.ca
        service_description     Partition /tmp
        check_command           check_me!check_disk!20%!10%!/tmp
        }

define service{
        use                     generic-service
        host_name               watch.bic.mni.mcgill.ca
        service_description     Partition /var/tmp
        check_command           check_me!check_disk!20%!10%!/var/tmp
        }

# Define a service to check the number of currently running procs
# Warning if > 500 processes, critical if > 800 processes.

define service{
        use                     generic-service
        host_name               watch.bic.mni.mcgill.ca
        service_description     Total Processes
        check_command           check_me!check_procs!500!800
        }

# Define a service to check the load on the local machine.

define service{
        use                     generic-service
        host_name               watch.bic.mni.mcgill.ca
        service_description     Current Load
        check_command           check_me!check_load!30.0!20.0!16.0!32.0!24.0!16.0
        }
/etc/nagios3/conf.d/services_nagios2.cfg contains commands related to hostgroup monitoring. This is a local modification that I made and ultimately should be moved to a BIC-* file, to keep things tidy.
~# cat /etc/nagios3/conf.d/services_nagios2.cfg

# check that web services are running
define service {
        hostgroup_name                  http-servers
        service_description             HTTP
        check_command                   check_http
        use                             generic-service
        notification_interval           0 ; set > 0 if you want to be renotified
}

# check that ssh services are running
define service {
        hostgroup_name                  bic-servers
        service_description             SSH
        check_command                   check_ssh
        use                             generic-service
        notification_interval           0 ; set > 0 if you want to be renotified
}

# check that ping-only hosts are up
define service {
        hostgroup_name                  ping-servers
        service_description             PING
        check_command                   check_ping!100.0,20%!500.0,60%
        use                             generic-service
        notification_interval           0 ; set > 0 if you want to be renotified
}
Web Interface Config
To have access to the Nagios web interface stuff the following on the web server in /etc/apache2/sites-enabled/000-default. Note that I have merged all the previous apache virtual hosts (nagios, munin) on noodles into 1 virtual host. I also have installed Ganglia fine-grain monitoring of the Xen Cluster but this will be documented elsewhere. (Disabled as of 20121114).
Access is performed with http over SSL (https), hence requires that the SSL key and X509 certificate be properly installed. This is an important feature because since the Nagios CGI scripts are enabled, one can easily disable or suspend a service an/or do nasty things remotely, so one must absolutely provide the good credentials when connecting to the Nagios web interface. Even more so when SNMP will be configured! See Nagios Certificate Setup and Renewal page for details.
Note that the Debian/Squeeze package for nagios will install an apache config file in /etc/apache2/conf.d/nagios. It should be modified so that authentication is done using a MD5 encrypted password over SSL. In the default file authentication is done using AuthType Basic and access is allowed for ALL. With AuthType MD5 care must be taken that the apache module auth_digest is enabled using a2enmod auth_digest. Then restart apache.
The file holding the user authentication is specified with AuthUserFile /etc/apache2/nagios.digest_pw. It is created (or modified) using the command htdigest -c /etc/apache2/nagios.digest_pw <realm> <username>.
<VirtualHost *:443>
    ServerAdmin bicadmin@bic.mni.mcgill.ca

    DocumentRoot /var/www
        ServerName matsya.bic.mni.mcgill.ca
        ServerAlias matsya

    <Directory />
        Options FollowSymLinks
        AllowOverride None
        Order Deny,Allow
        Deny from all
        Allow from 132.206.178.
    </Directory>

    <Directory /var/www/>
        Options Indexes FollowSymLinks MultiViews
        AllowOverride None
        Order Deny,Allow
        Deny from all
        Allow from 132.206.178.
    </Directory>

    ScriptAlias /cgi-bin/ /usr/lib/cgi-bin/

    <Directory "/usr/lib/cgi-bin">
        AllowOverride None
        Options +ExecCGI -MultiViews +SymLinksIfOwnerMatch
        Order Deny,Allow
        Deny from all
        Allow from 132.206.178.
    </Directory>

    ErrorLog ${APACHE_LOG_DIR}/error.log

    # Possible values include: debug, info, notice, warn, error, crit,
    # alert, emerg.
    LogLevel warn

    CustomLog ${APACHE_LOG_DIR}/access.log combined

    Alias /doc/ "/usr/share/doc/"
    <Directory "/usr/share/doc/">
        Options Indexes MultiViews FollowSymLinks
        AllowOverride None
        Order Deny,Allow
        Deny from all
        Allow from 127.0.0.0/255.0.0.0 ::1/128
    </Directory>

#######################################################
# Nagios
#######################################################

    <Directory /usr/lib/cgi-bin/nagios3>
        Options +ExecCGI
        AddHandler cgi-script .cgi
    </Directory>

# Where the stylesheets (config files) reside
    Alias /nagios3/stylesheets /etc/nagios3/stylesheets

# Where the HTML pages live
    Alias /nagios3 /usr/share/nagios3/htdocs

    SSLEngine On
    SSLOptions +FakeBasicAuth +ExportCertData +StrictRequire
    SSLProtocol all
    SSLCipherSuite HIGH:MEDIUM
    SSLCertificateFile    /etc/apache2/ssl/matsya.bic.mni.mcgill.ca.pem
    SSLCertificateKeyFile /etc/apache2/ssl/matsya.bic.mni.mcgill.ca.key

    <DirectoryMatch (/usr/share/nagios3/htdocs|/usr/share/nagios3/htdocs/docs|/usr/lib/cgi-bin/nagios3)>
        SSLRequireSSL

        Options FollowSymLinks
        DirectoryIndex index.html
        AllowOverride AuthConfig
        Order Deny,Allow
        Deny from all
        Allow from 132.206.178.125
        Allow from 132.206.178.171

        AuthName "Nagios Admin"
        AuthType Digest
        AuthDigestAlgorithm MD5
        AuthDigestProvider file
        AuthUserFile /etc/apache2/nagios.digest_pw

        require valid-user
    </DirectoryMatch>

</VirtualHost>
Nagios Web Interface and NagiosGraph Plugin Installation and Configuration
- Nov 2014: Installed and configured NagiosGraph, a Nagios plugin not packaged in the Debian repositaries.
- Allows visualization/plots of plugins’ output and performance data using
Round Robin Databasesinrrdtools. - Installed a few requisite packages:
apt-get install libcgi-pm-perl librrds-perl libgd-gd2-perl. - Created and installed a deb package using the
install.plscript included in the NagiosgGraph source code. - Modify the main NagiosGraph conf file
/etc/nagiosgraph/nagiosgraph.conf:
logfile = /var/log/nagiosgraph/nagiosgraph.log
cgilogfile = /var/log/nagiosgraph/nagiosgraph-cgi.log
perflog = /tmp/perfdata.log
rrddir = /var/spool/nagiosgraph/rrd
nagioscgiurl = /nagios3/cgi-url
labelfile = /etc/nagiosgraph/labels.conf
groupdb = /etc/nagiosgraph/groupdb.conf
datasetdb = /etc/nagiosgraph/datasetdb.conf
default_geometry = 650x100
refresh = 300
showgraphtitle = true
- An apache config file is created by the nagiosgraph.deb package upon its installation:
/etc/apache2/conf.d/nagiosgraph.conf

# enable nagiosgraph CGI scripts
ScriptAlias /nagiosgraph/cgi-bin "/usr/lib/cgi-bin/nagiosgraph"
<Directory "/usr/lib/cgi-bin/nagiosgraph">
   Options ExecCGI
   AllowOverride None
   Order allow,deny
   Allow from all
#   AuthName "Nagios Access"
#   AuthType Basic
#   AuthUserFile NAGIOS_ETC_DIR/htpasswd.users
#   Require valid-user
</Directory>
# enable nagiosgraph CSS and JavaScript
Alias /nagiosgraph "/usr/share/nagiosgraph/htdocs"
<Directory "/usr/share/nagiosgraph/htdocs">
   Options None
   AllowOverride None
   Order allow,deny
   Allow from all
</Directory>
- Nagios config file
/etc/nagios3/nagios.cfgmodified to allow performance data processing — not enabled by default.
# begin nagiosgraph configuration
# process nagios performance data using nagiosgraph
process_performance_data=1
service_perfdata_file=/tmp/perfdata.log
service_perfdata_file_template=$LASTSERVICECHECK$||$HOSTNAME$||$SERVICEDESC$||$SERVICEOUTPUT$||$SERVICEPERFDATA$
service_perfdata_file_mode=a
service_perfdata_file_processing_interval=30
service_perfdata_file_processing_command=process-service-perfdata-for-nagiosgraph
# end nagiosgraph configuration
- Nagios command definition file
/etc/nagios3/commands.cfgmodified to add the NagiosGraph stuff:
# begin nagiosgraph configuration
# command to process nagios performance data for nagiosgraph
define command {
  command_name process-service-perfdata-for-nagiosgraph
  command_line /usr/lib/nagiosgraph/insert.pl
}
# end nagiosgraph configuration
- Install the NagiosGraph SSI file in the Nagios document root dir:
cp share/nagiosgraph.ssi /usr/share/nagios3/htdocs/ssi/common-header.ssi - No modifications necessary to the NagiosGraph map file if plugin outputs and perf data are in standard format.
- Modifications of Nagios BIC services and command files to consolidate the Digitemp Sensors output in one rrd file.
- Modified the Nagios SideBar (
/usr/share/nagios3/htdocs/side.php) underTrendsto add links to the NagiosGraph CGI scripts.
<ul>
<li><a href="/nagios/cgi-bin/show.cgi" target="main">Graphs</a></li>
<li><a href="/nagios/cgi-bin/showhost.cgi" target="main">Graphs by Host</a></li>
<li><a href="/nagios/cgi-bin/showservice.cgi" target="main">Graphs by Service</a></li>
<li><a href="/nagios/cgi-bin/showgroup.cgi" target="main">Graphs by Group</a></li>
</ul>
- Added a NagiosGraph group by creating to
/etc/nagiosgraph/groupdb.conf. Dont forget to update NagiosGraph config file!
#/JF/ 20141103.

Temperature=gertrude.bic.mni.mcgill.ca,Digitemp%20Temperature%20Sensors
Temperature=ups-a2-1,UPS%20Battery%20Temperature
Temperature=ups-a2-2,UPS%20Battery%20Temperature
Temperature=ups-a4-1,UPS%20Battery%20Temperature
Temperature=ups-a4-2,UPS%20Battery%20Temperature
Temperature=pdu-a1-1,EnviroSense%20Probe%20Temperature
Temperature=pdu-a1-2,EnviroSense%20Probe%20Temperature
Temperature=pdu-a2-1,EnviroSense%20Probe%20Temperature
Temperature=pdu-a2-2,EnviroSense%20Probe%20Temperature
Temperature=pdu-a3-1,EnviroSense%20Probe%20Temperature
Temperature=pdu-a3-2,EnviroSense%20Probe%20Temperature
Temperature=pdu-a4-1,EnviroSense%20Probe%20Temperature
Temperature=pdu-a4-2,EnviroSense%20Probe%20Temperature
Temperature=pdu-a5-1,EnviroSense%20Probe%20Temperature
Temperature=pdu-a5-2,EnviroSense%20Probe%20Temperature

DigiTemp=gertrude.bic.mni.mcgill.ca,Digitemp%20Temperature%20Sensors

UPSBatteryTemp=ups-a2-1,UPS%20Battery%20Temperature
UPSBatteryTemp=ups-a2-2,UPS%20Battery%20Temperature
UPSBatteryTemp=ups-a4-1,UPS%20Battery%20Temperature
UPSBatteryTemp=ups-a4-2,UPS%20Battery%20Temperature

EnviroSensePDUTemperature=pdu-a1-1,EnviroSense%20Probe%20Temperature
EnviroSensePDUTemperature=pdu-a1-2,EnviroSense%20Probe%20Temperature
EnviroSensePDUTemperature=pdu-a2-1,EnviroSense%20Probe%20Temperature
EnviroSensePDUTemperature=pdu-a2-2,EnviroSense%20Probe%20Temperature
EnviroSensePDUTemperature=pdu-a3-1,EnviroSense%20Probe%20Temperature
EnviroSensePDUTemperature=pdu-a3-2,EnviroSense%20Probe%20Temperature
EnviroSensePDUTemperature=pdu-a4-1,EnviroSense%20Probe%20Temperature
EnviroSensePDUTemperature=pdu-a4-2,EnviroSense%20Probe%20Temperature
EnviroSensePDUTemperature=pdu-a5-1,EnviroSense%20Probe%20Temperature
EnviroSensePDUTemperature=pdu-a5-2,EnviroSense%20Probe%20Temperature
- Added a Nagios Service Groups file
/etc/nagios3/conf.d/BIC-servicegroups.cfg
define servicegroup{
    servicegroup_name       EnviroSense
    alias                   EnviroSense Probe Temperature
    action_url              /nagiosgraph/cgi-bin/showgroup.cgi?group=EnviroSensePDUTemperature
}
define servicegroup{
    servicegroup_name       UPSTemp
    alias                   TrippLite UPS Battery Temperature
    action_url              /nagiosgraph/cgi-bin/showgroup.cgi?group=UPSBatteryTemperature
}
- Added a Nagios generic service command
graphed-servicein/etc/nagios3/conf.d/BIC-services-generic.cfg(folded):
# /JF/ 20141106. NagiosGraph CGI Javascript shiite.
define service {
    name                    graphed-service
    action_url              /nagiosgraph/cgi-bin/show.cgi?host=$HOSTNAME$&service=$SERVICEDESC$' \
                            onMouseOver='showGraphPopup(this)' onMouseOut='hideGraphPopup()'     \
                            rel='/nagiosgraph/cgi-bin/showgraph.cgi?host=$HOSTNAME$&service=$SERVICEDESC$&rrdopts=-w+650-j
    register 0
    }
- Added Nagios
Extra Service Actionsstuff (action_urlstanza in the service definition) to have plots generated by hovering the mouse pointer over the action icon. Just add the above service namegraphed-serviceto theusestanza in the service definition for the host group:
define service {
    hostgroup_name          tripplite-ups
    use                     bic-generic-service, graphed-service
    service_description     UPS Battery Temperature
    servicegroups           UPSTemp
    check_command           check_snmp!2c!secret!UPS-MIB::upsBatteryTemperature.0!C!32!37
    contact_groups          bicadmin,texters
    notification_interval   0 ; minutes, set > 0 if you want to be renotified
}
- The Digitemp plugin/perl script
- Outputs
OK - Temperature OK - Sensor0 16.84 C, Temperature OK - Sensor1 17.28 C, Temperature OK - Sensor2 22.00 C, |Sensor0=16.84;29;35 Sensor1=17.28;29;35 Sensor2=22.00;29;35
#!/usr/bin/perl -w

eval '(exit $?0)' && eval 'exec /usr/bin/perl $0 ${1+"$@"}'
&& eval 'exec /usr/bin/perl $0 $argv:q'
if 0;

# Local mods by Jean-Francois Malouin <malin@bic.mni.mcgill.ca> stolen (no shame) from:
#
# check_digitemp.pl Copyright (C) 2002 by Brian C. Lane <bcl@brianlane.com>
#
# This is a NetSaint plugin script to check the temperature on a local
# machine. Remote usage may be possible with SSH
#
# Permission is hereby granted, free of charge, to any person obtaining a copy
# of this software and associated documentation files (the "Software"), to
# deal in the Software without restriction, including without limitation the
# rights to use, copy, modify, merge, publish, distribute, sublicense, and/or
# sell copies of the Software, and to permit persons to whom the Software is
# furnished to do so, subject to the following conditions:
#
# The above copyright notice and this permission notice shall be included in
# all copies or substantial portions of the Software.
#
# THE SOFTWARE IS PROVIDED "AS IS", WITHOUT WARRANTY OF ANY KIND, EXPRESS OR
# IMPLIED, INCLUDING BUT NOT LIMITED TO THE WARRANTIES OF MERCHANTABILITY,
# FITNESS FOR A PARTICULAR PURPOSE AND NONINFRINGEMENT. IN NO EVENT SHALL THE
# AUTHORS OR COPYRIGHT HOLDERS BE LIABLE FOR ANY CLAIM, DAMAGES OR OTHER
# LIABILITY, WHETHER IN AN ACTION OF CONTRACT, TORT OR OTHERWISE, ARISING
# FROM, OUT OF OR IN CONNECTION WITH THE SOFTWARE OR THE USE OR OTHER DEALINGS
# IN THE SOFTWARE.
#
# ===========================================================================
# Howto Install in NetSaint (tested with v0.0.7)
#
# 1. Copy this script to /usr/local/netsaint/libexec/ or wherever you have
#    placed your NetSaint plugins
#
# 2. Create a digitemp config file in /usr/local/netsaint/etc/
#    eg. digitemp -i -s/dev/ttyS0 -c /usr/local/netsaint/etc/digitemp.conf
#
# 3. Make sure that the webserver user has permission to access the serial
#    port being used.
#
# 4. Add a command to /usr/local/netsaint/etc/commands.cfg like this:
#    command[check-temp]=$USER1$/check_digitemp.pl -w $ARG1$ -c $ARG2$ \
#    -t $ARG3$ -f $ARG4$
#    (fold into one line)
#
# 5. Tell NetSaint to monitor the temperature by adding a service line like
#    this to your hosts.cfg file:
#    service[kermit]=Temperature;0;24x7;3;5;1;home-admins;120;24x7;1;1;1;; \
#    check-temp!65!75!1!/usr/local/netsaint/etc/digitemp.conf
#    (fold into one line)
#    65 is the warning temperature
#    75 is the critical temperature
#    1 is the sensor # (as reported by digitemp -a) to monitor
#    digitemp.conf is the path to the config file
#
# 6. If you use Centigrade instead of Fahrenheit, change the commands.cfg
#    line to include the -C argument. You can then pass temperature limits in
#    Centigrade in the service line.
#
# ===========================================================================
# Howto Install in Nagios (tested with v1.0b4)
#
# 1. Copy this script to /usr/local/nagios/libexec/ or wherever you have
#    placed your Nagios plugins
#
# 2. Create a digitemp config file in /usr/local/nagios/etc/
#    eg. digitemp -i -s/dev/ttyS0 -c /usr/local/nagios/etc/digitemp.conf
#
# 3. Make sure that the webserver user has permission to access the serial
#    port being used.
#
# 4. Add a command to /usr/local/nagios/etc/checkcommands.cfg like this:
#
#    #DigiTemp temperature check command
#    define command{
#        command_name    check_temperature
#        command_line    $USER1$/check_digitemp.pl -w $ARG1$ -c $ARG2$ \
#        -t $ARG3$ -f $ARG4$
#    (fold above into one line)
#        }
#
# 5. Tell NetSaint to monitor the temperature by adding a service line like
#    this to your service.cfg file:
#
#    #DigiTemp Temperature check Service definition
#    define service{
#        use                         generic-service
#        host_name                       kermit
#        service_description             Temperature
#        is_volatile                     0
#        check_period                    24x7
#        max_check_attempts              3
#        normal_check_interval           5
#        retry_check_interval            2
#        contact_groups                  home-admins
#        notification_interval           240
#        notification_period             24x7
#        notification_options            w,u,c,r
#        check_command                   check_temperature!65!75!1!  \
#        /usr/local/nagios/etc/digitemp.conf
#        (fold into one line)
#        }
#
#    65 is the warning temperature
#    75 is the critical temperature
#    1 is the sensor # (as reported by digitemp -a) to monitor
#    digitemp.conf is the path to the config file
#
# 6. If you use Centigrade instead of Fahrenheit, change the checkcommands.cfg
#    line to include the -C argument. You can then pass temperature limits in
#    Centigrade in the service line.
#
# ===========================================================================

# Modules to use
use strict;
use Getopt::Std;
use lib qw(/usr/lib/nagios/plugins /usr/lib64/nagios/plugins); # possible paths to your Nagios plugins and utils.pm
use utils qw(%ERRORS);

# Define all our variable usage
use vars qw($opt_c $opt_f $opt_w $opt_F $opt_C
	    @temperature $t $conf_file $sensor
	    $crit_level $warn_level $null
            $percent $fmt_pct
            $verb_err $command_line);

# Show usage
sub usage()
{
  print "\ncheck_all_digitemp.pl - Nagios Plugin\n";
  print "\nby Jean-Francois Malouin <malin\@bic.mni.mcgill.ca>, stolen (noshame) from\n";
  print "\ncheck_digitemp.pl v1.0 - NetSaint Plugin\n";
  print "Copyright 2002 by Brian C. Lane <bcl\@brianlane.com>\n";
  print "See source for License\n";
  print "usage:\n";
  print " check_digitemp.pl -f <config file> -w <warnlevel> -c <critlevel>\n\n";
  print "options:\n";
  print " -f               DigiTemp Config File\n";
  print " -w temperature   temperature >= to warn\n";
  print " -c temperature   temperature >= when critical\n";

  exit $ERRORS{'UNKNOWN'};
}

sub max_state ($$) {
    my ($current, $compare) = @_;

    if (($compare eq 'CRITICAL') || ($current eq 'CRITICAL')) {
        return 'CRITICAL';
    } elsif ($compare eq 'OK') {
        return $current;
    } elsif ($compare eq 'WARNING') {
        return 'WARNING';
    } elsif (($compare eq 'UNKNOWN') && ($current eq 'OK')) {
        return 'UNKNOWN';
    } else {
        return $current;
    }
}

sub exitreport ($$) {
    my ($status, $message) = @_;

    print STDOUT "$status - $message\n";
    exit $ERRORS{$status};
}

# Get the options
if ($#ARGV le 0)
{
  &usage;
} else {
  getopts('f:c:w:');
}

# Shortcircuit the switches
if (!$opt_w or $opt_w == 0 or !$opt_c or $opt_c == 0)
{
  print "*** You must define WARN and CRITICAL levels!";
  &usage;
}

# Check if levels are sane
if ($opt_w >= $opt_c)
{
  print "*** WARN level must not be greater than CRITICAL when checking temperature!";
  &usage;
}

$warn_level   = $opt_w;
$crit_level   = $opt_c;

# Default config file is /etc/digitemp.conf
if(!$opt_f)
{
  $conf_file = "/etc/digitemp.conf";
} else {
  $conf_file = $opt_f;
}

# Check for config file
if( !-f $conf_file ) {
  print "*** You must have a digitemp.conf file\n";
  &usage;
}

# Read the output from digitemp.
# Use Celsius by default, stupid American.
# Output in form 0\troom\tattic\tdrink
open( DIGITEMP, "/usr/bin/digitemp -c $conf_file -a -q -o 2 |" );

# Process the output from the command
while( <DIGITEMP> )
{
#  print "$_\n";
  chomp;

  if( $_ =~ /^nanosleep/i )
  {
    close(DIGITEMP);
    exitreport('UNKNOWN',"Error reading sensor #$sensor\n");
  } else {
    # Check for an error from digitemp, and report it instead
    if( $_ =~ /^Error.*/i ) {
      close(DIGITEMP);
      exitreport('UNKNOWN',"$_");
    } else {
      ($null,@temperature) = split(/\t/);
    }
  }
}
close( DIGITEMP );

my $sensor=0;
my $output = "";
my $perfdata = "";
my $status = 'OK';
for $t (@temperature) {

    if( $t and $t >= $crit_level )
    {
        $output = $output . "Temperature CRITICAL - Sensor$sensor $t C, ";
        $perfdata = $perfdata . "Sensor$sensor=$t;$warn_level;$crit_level ";
        $status = max_state($status, 'CRITICAL');

    } elsif ($t and $t >= $warn_level ) {
        $output = $output . "Temperature WARNING - Sensor$sensor $t C, ";
        $perfdata = $perfdata . "Sensor$sensor=$t;$warn_level;$crit_level ";
        $status = max_state($status, 'WARNING');
    } elsif( $t ) {
        $output = $output . "Temperature OK - Sensor$sensor $t C, ";
        $perfdata = $perfdata . "Sensor$sensor=$t;$warn_level;$crit_level ";
        $status = max_state($status, 'OK');
    } else {
        $output = $output . "Error parsing result for sensor$sensor, ";
        $status = max_state($status, 'UNKNOWN');
    }
    $sensor++;
}

$output .= "|$perfdata";
exitreport("$status","$output");

# vim: tabstop=4 expandtab shiftwidth=4 softtabstop=4
Client Setup
Active Checks
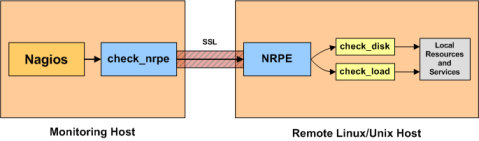
The Nagios server queries and communicates with the clients using the Nagios Remote Process Executor, or nrpe:
Install the nagios nrpe plugins and sudo:
ii  nagios-nrpe-plugin                                      2.12-4                         Nagios Remote Plugin Executor Plugin
ii  nagios-nrpe-server                                      2.12-4                         Nagios Remote Plugin Executor Server
ii  nagios-plugins                                          1.4.15-3                       Plugins for the nagios network monitoring and management system
ii  nagios-plugins-basic                                    1.4.15-3                       Plugins for the nagios network monitoring and management system
ii  nagios-plugins-standard                                 1.4.15-3                       Plugins for the nagios network monitoring and management system
ii  sudo                                                    1.7.4p4-2.squeeze.1            Provide limited super user privileges to specific users
Set the following in the nrpe daemon configuration file /etc/nagios/nrpe.cfg. The variable allowed_hosts should contain the IP address of the Nagios master. Add localhost for good measure.
The variable dont_blame_nrpe must be set to 1 (0 is the default) if one wants the local nrpe server to run commands as per the Nagios master requests. One must then also specify command_prefix=/usr/bin/sudo and allow the nrpe server to run any command in /usr/lib/nagios/plugins/ as root by modifying /etc/sudoers accordingly.
pid_file=/var/run/nagios/nrpe.pid
server_port=5666
server_address=132.206.178.XXX
nrpe_user=nagios
nrpe_group=nagios
allowed_hosts=127.0.0.1,132.206.178.240
dont_blame_nrpe=1
command_prefix=/usr/bin/sudo
debug=0
command_timeout=60
command[check_disk]=/usr/lib/nagios/plugins/check_disk -w $ARG1$ -c $ARG2$ -p $ARG3$
command[check_load]=/usr/lib/nagios/plugins/check_load -w $ARG1$,$ARG2$,$ARG3$ -c $ARG4$,$ARG5$,$ARG6$
command[check_procs]=/usr/lib/nagios/plugins/check_procs -w $ARG1$ -c $ARG2$
command[check_users]=/usr/lib/nagios/plugins/check_users -w $ARG1$ -c $ARG2$
command[check_digitemp]=/usr/lib/nagios/plugins/check_digitemp -C -w $ARG1$ -c $ARG2$ -t $ARG3$ -f $ARG4$
include=/etc/nagios/nrpe_local.cfg
Comment out all the the rest of the stuff.
server_address=X.X.X.X where XXXX is the IP of the client. This is because by default nrpe will bind to all configured network interfaces. If you want to restrict the binding then set server_address to the IP of the eth0 interface (or whatever you want to listen to).
Use sudo to allow the local nagios user to run the requested remote nrpe commands as root: stuff the following in /etc/sudoers (using visudo)
nagios ALL=(ALL) NOPASSWD: /usr/lib/nagios/plugins/
The nrpe daemon is linked with the libwrap (tcp wrappers) library so one must modify /etc/hosts.allow to allow connections from the Nagios server:
# Nagios nrpe deamon
nrpe: 132.206.178.240
NRPE Server Debug
First verify that the daemon on the nrpe server is running and waiting for connections:
~# netstat -a -p | grep nrpe
tcp        0      0 gaspar.bic.mni.mcg:5666 *:*                     LISTEN      6114/nrpe
unix  2      [ ]         DGRAM                    17278    6114/nrpe
Now that the nrpe daemon is running verify that it is responding by performing the following command from a host that has permission to connect to the nrpe daemon:
~# /usr/lib/nagios/plugins/check_nrpe -H <hostname>
NRPE v2.12
Passive Checks
The major difference between active and passive checks is that active checks are initiated and performed by Nagios, while passive checks are performed by external applications.
From the Nagios doc itself:
In most cases you’ll use Nagios to monitor your hosts and services using regularly scheduled active checks. Active checks can be used to “poll” a device or service for status information every so often. Nagios also supports a way to monitor hosts and services passively instead of actively. They key features of passive checks are as follows:
- Passive checks are initiated and performed by external applications/processes
- Passive check results are submitted to Nagios for processing
Here’s how passive checks work in more detail…
- An external application checks the status of a host or service.
- The external application writes the results of the check to the external command file (really, just a named pipe).
- The next time Nagios reads the external command file it will place the results of all passive checks into a queue for later processing. The same queue that is used for storing results from active checks is also used to store the results from passive checks.
- Nagios will periodically execute a check result reaper event and scan the check result queue. Each service check result that is found in the queue is processed in the same manner - regardless of whether the check was active or passive. Nagios may send out notifications, log alerts, etc. depending on the check result information.
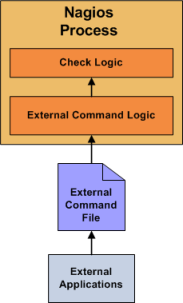
The processing of active and passive check results is essentially identical. This allows for seamless integration of status information from external applications with Nagios.
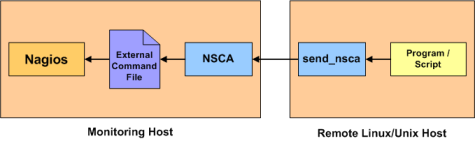
If an application that resides on the same host as Nagios is sending passive host or service check results, it can simply write the results directly to the external command file. However, applications on remote hosts can’t do this so easily.
NSCA (Nagios Service Check Acceptor) is a Nagios addon that allows a remote client to be queried passively. The NSCA addon consists of a daemon that runs on the Nagios hosts and a client that is executed from remote hosts. The daemon will listen for connections from remote clients, perform some basic validation on the results being submitted, and then write the check results directly into the external command file (as described above)
BIC Passive Checks
I have enabled passive hosts and resources checks on the Nagios host. Essentially the problem was that one particular service check (for a LSI MegaRaid controller) was taking too much time to run on a remote host and I had to push a global Nagios config value (service_check_timeout) up to +2mins so that Nagios would not kill the check and return with a CRITICAL error Service Check Timed Out. This is a global value and I didn’t like the fact that just because one single service check was timing out I had to make such a global change. So enter passive checks and NSCA!
First install the NSCA addon on server and all the clients that will send back active checks:
ii nsca 2.7.2+nmu2 Nagios service monitor agent
Since the NSCA daemon on the Nagios host is not tcp-wrapped, I configured it as an inetd service. The /etc/inetd.conf file contains an entry
nsca stream tcp nowait nagios /usr/sbin/tcpd /usr/sbin/nsca -c /etc/nsca.cfg --inetd
Add an entry in /etc/hosts.allow to only allow access from the hosts you need to run passive checks:
nsca: 132.206.178.52
in this case, host tatania (ip 132.206.178.52).
The NSCA config file is pretty standard, the only things I changed is to turn on debug at first and set a password and an encryption algorightm to encode the server-clients traffic. It is also important to protect /etc/nsca.cfg such that only the user running the nsca service (nagios) can read it. The password and encryption algorithm MUST be the same on all the clients.
pid_file=/var/run/nsca.pid
server_port=5667
nsca_user=nagios
nsca_group=nogroup
debug=1
command_file=/var/lib/nagios3/rw/nagios.cmd
alternate_dump_file=/var/run/nagios/nsca.dump
aggregate_writes=0
append_to_file=0
max_packet_age=30
password=********
decryption_method=3
On the client, in the send_nsca config file (send_nsca.cfg) just set the password and encryption exactly as on the server above and change its permissions so that only user nagios can shine his eyes on it.
Now, on the Nagios host one has to create the passive service checks definitions. I created a config file /etc/nagios3/conf.d/BIC-passive-services.cfg containing one template and one definition:
define service{
    use                     generic-service
    name                    passive_service
    active_checks_enabled   0
    passive_checks_enabled  1               # We want only passive checking
    flap_detection_enabled  0
    register                0               # This is a template, not a real service
    is_volatile             1
    check_period            24x7
    max_check_attempts      1
    normal_check_interval   5
    retry_check_interval    1
    check_freshness         0
    contact_groups          bicadmin,texters
    check_command           check_dummy!0
    notification_interval   120
    notification_period     24x7
    notification_options    w,u,c,r
    stalking_options        w,c,u
    }
define service{
    use                     passive_service
    host_name               tatania.bic.mni.mcgill.ca
    service_description     nsca_check_megaraid_sas
    is_volatile             1
    check_freshness         1
    freshness_threshold     3720 # 1hr + 2mins
    notification_interval   0
    check_command           check_dummy!2!"MegaSAS raid card monitor gone AWOL! Check nagios cronjob on tatania asap!"
    }
A few things to notice about the first service definition:
- the service
passive_checkdefinition is a template - it disables active checks,
active_checks_enabled 0 - it enables passive checks,
passive_checks_enabled 1 - it makes the service checks volatile:
is_volatile 1 - the check_freshness flag is set so that after a freshness_threshold value of 1hr + 2mins an active check will be performed (even is active_check is disabled)
- Notification interval is set 0: Nagios will not perform checks of the service on a regular basis. It will, however, still perform on-demand checks.
It is important to note that the service_description value MUST be used by the send_nsca output string sent to Nagios. Nagios will happily discard those passive check service requests that are not registered in it config files.
Nagios expect to receive input in its external command file with the format:
<host_name>[tab]<service_description>[tab]<return_code>[tab]<plugin_output>[newline]
The <host_name> and <service_description> strings must correspond to the values of host_name and service_description in the passive service check definition.
LSI MegaRaid Controller Passive Checks
Homepage: https://github.com/glensc/nagios-plugin-check_raid) that supports hardware and software raid like 3ware and LSI and Linux MD/Raid among other things which is just what we want.
I ripped a nagios plugin from the net to probe the status of a LSI MegaRAID SAS Raid controller:
#!/usr/bin/perl -w

###
# Locally modified by JF in order to conform to MegaCLI SAS RAID Management Tool Ver 8.02.16 July 01, 2011.
#
# -20120114. Modified output string. Added hooks for BBU status monitoring.
# -20120127. Added an timeout option as the CLI can sometimes take more than 120s to return
#            and Nagios will complain with a 'CRITICAL' exit value, 'Check Socket timeout'.
#
# Stuff to find out:
# - In the output of '$megacli -PdList  -a$adp' what are the possible values of
# ^Firmware State? So far I've found 'Online, Spun Up' and maybe 'Rebuild'.
# - In the output of '$megacli -LdInfo -L$ld -a$adp' what are the possible values of:
# ^State:? So far I've been able to determined 'Optimal' and maybe 'Degraded'.
###

# check_megaraid_sas Nagios plugin
# Copyright (C) 2007  Jonathan Delgado, delgado@molbio.mgh.harvard.edu
#
# This program is free software; you can redistribute it and/or
# modify it under the terms of the GNU General Public License
# as published by the Free Software Foundation; either version 2
# of the License, or (at your option) any later version.
#
# This program is distributed in the hope that it will be useful,
# but WITHOUT ANY WARRANTY; without even the implied warranty of
# MERCHANTABILITY or FITNESS FOR A PARTICULAR PURPOSE.  See the
# GNU General Public License for more details.
#
# You should have received a copy of the GNU General Public License
# along with this program; if not, write to the Free Software
# Foundation, Inc., 51 Franklin Street, Fifth Floor, Boston, MA  02110-1301, USA.
#
#
# Nagios plugin to monitor the status of volumes attached to a LSI Megaraid SAS
# controller, such as the Dell PERC5/i and PERC5/e. If you have any hotspares
# attached to the controller, you can specify the number you should expect to
# find with the '-s' flag.
#
# The paths for the Nagios plugins lib and MegaCli may need to me changed.
#
# Code for correct RAID level reporting contributed by Frode Nordahl, 2009/01/12.
#
# $Author: delgado $
# $Revision: #12 $ $Date: 2010/10/18 $

use strict;
use Getopt::Std;
use Time::HiRes qw(gettimeofday);
use lib qw(/usr/lib/nagios/plugins /usr/lib64/nagios/plugins); # possible pathes to your Nagios plugins and utils.pm
use utils qw(%ERRORS);

our($opt_h, $opt_s, $opt_o, $opt_m, $opt_p, $opt_t);


getopts('hs:o:p:m:t:');

if ( $opt_h ) {
        print "Usage: $0 [-s number] [-m number] [-o number] [-t seconds]\n";
        print "       -s is how many hotspares are attached to the controller\n";
        print "       -m is the number of media errors to ignore\n";
        print "       -p is the predictive error count to ignore\n";
        print "       -o is the number of other disk errors to ignore\n";
        print "       -t is the timeout in seconds we can wait for the plugin to return\n";
        exit;
}

#my $megaclibin = '/usr/sbin/MegaCli';  # the full path to your MegaCli binary
my $megaclibin = '/opt/lsi/MegaCli64';  # the full path to your MegaCli binary
#my $megacli = "sudo $megaclibin";      # how we actually call MegaCli
my $megacli = "$megaclibin";      # how we actually call MegaCli
my $megapostopt = '-NoLog';            # additional options to call at the end of MegaCli arguments

my ($adapters);
my $hotspares = 0;
my $hotsparecount = 0;
my $commhotsparecount = 0;
my $pdbad = 0;
my $pdcount = 0;
my $mediaerrors = 0;
my $mediaallow = 0;
my $prederrors = 0;
my $predallow = 0;
my $othererrors = 0;
my $otherallow = 0;
my $result = '';
my $status = 'OK';
my $timeout = 30;               # 30secs for timing out, by default.

# Signal handler so that we can catch alarm timeouts and exit with a nagios 'UNKNOWN' status.
$SIG{ALRM} = sub { die "timeout" };

sub max_state ($$) {
        my ($current, $compare) = @_;

        if (($compare eq 'CRITICAL') || ($current eq 'CRITICAL')) {
                return 'CRITICAL';
        } elsif ($compare eq 'OK') {
                return $current;
        } elsif ($compare eq 'WARNING') {
                return 'WARNING';
        } elsif (($compare eq 'UNKNOWN') && ($current eq 'OK')) {
                return 'UNKNOWN';
        } else {
                return $current;
        }
}

sub exitreport ($$) {
        my ($status, $message) = @_;

        print STDOUT "$status - $message\n";
        exit $ERRORS{$status};
}


if ( $opt_s ) {
        $hotspares = $opt_s;
}
if ( $opt_m ) {
        $mediaallow = $opt_m;
}
if ( $opt_p ) {
        $predallow = $opt_p;
}
if ( $opt_o ) {
        $otherallow = $opt_o;
}
if ( $opt_t ) {
        $timeout = $opt_t;
}

# Cookbook recipe. Encapsulate the long-to-run commands in the eval.
my $before = gettimeofday;
eval {
    # Start the timer. If it pops, then the eval will return with
    # the output from the signal handler ("timeout") defined above.
    alarm($timeout);

    # long-time ops here

# Some sanity checks that you actually have something where you think MegaCli is
    (-e $megaclibin)
        || exitreport('UNKNOWN',"error: $megaclibin does not exist");

# Get the number of RAID controllers we have
    open (ADPCOUNT, "$megacli -adpCount $megapostopt |")
        || exitreport('UNKNOWN',"error: Could not execute $megacli -adpCount $megapostopt");

    while (<ADPCOUNT>) {
        if ( m/Controller Count:\s*(\d+)/ ) {
            $adapters = $1;
            last;
        }
    }
    close ADPCOUNT;

    ADAPTER: for ( my $adp = 0; $adp < $adapters; $adp++ ) {
        # Get the number of logical drives on this adapter
    ###########################################################################
    #    open (LDGETNUM, "$megacli -LdGetNum -a$adp $megapostopt |")
    #        || exitreport('UNKNOWN', "error: Could not execute $megacli -LdGetNum -a$adp $megapostopt");
    #
    #   my ($ldnum);
    #   while (<LDGETNUM>) {
    #           if ( m/Number of Virtual drives configured on adapter \d:\s*(\d+)/i ) {
    #                   $ldnum = $1;
    #                   last;
    #           }
    #   }
    #   close LDGETNUM;
    ###########################################################################

        # JF: The above won't do as it assumes that the logical drives target IDs are consecutive from 0
        #     to $ldnum which is not necessarely true. So we'll slurp the output from -ShowSummary
        #     for a given adapter and find a match for the target ID in the output stream:
        #     'Virtual drive      : Target Id 1 ,VD name'

        open (LDGETNUM, "$megacli -ShowSummary -a$adp $megapostopt |")
                    || exitreport('UNKNOWN', "error: Could not execute $megacli -ShowSummary -a$adp $megapostopt");

        my (@adpLd);
        while (<LDGETNUM>) {
            if ( m/Virtual drive\s*:\s*Target Id\s*(\d+)/i ) {
                push @adpLd, $1;
#                       print "adapter $adp, logical drive $1\n";
            }
        }
        close LDGETNUM;

        LDISK: foreach my $ld ( @adpLd ) {
            # Get info on this particular logical drive
            open (LDINFO, "$megacli -LdInfo -L$ld -a$adp $megapostopt |")
                || exitreport('UNKNOWN', "error: Could not execute $megacli -LdInfo -L$ld -a$adp $megapostopt ");

            my ($size, $unit, $raidlevel, $ldpdcount, $state, $spandepth);
            while (<LDINFO>) {
                if ( m/^Size\s*:\s*((\d+\.?\d*)\s*(MB|GB|TB))/ ) {
                    $size = $2;
                    $unit = $3;
                    # Adjust MB to GB if that's what we got
                    if ( $unit eq 'MB' ) {
                        $size = sprintf( "%.0f", ($size / 1024) );
                        $unit= 'GB';
                    }
                    if ( $unit eq 'TB' ) {
                        $size = sprintf( "%.0f", ($size * 1024) );
                        $unit= 'GB';
                    }
                } elsif ( m/State\s*:\s*(\w+)/ ) {
                    $state = $1;
                    if ( $state ne 'Optimal' ) {
                        $status = 'WARNING';
                    }
                    if ( $state eq 'Degraded' ) {
                        $status = 'CRITICAL';
                    }
                } elsif ( m/Number Of Drives\s*(per span\s*)?:\s*(\d+)/ ) {
                    $ldpdcount = $2;
                } elsif ( m/Span Depth\s*:\s*(\d+)/ ) {
                    $spandepth = $1;
                } elsif ( m/RAID Level\s*: Primary-(\d)/ ) {
                    $raidlevel = $1;
                }
            }
            close LDINFO;

            # Report correct RAID-level and number of drives in case of Span configurations
            if ($ldpdcount && $spandepth > 1) {
                $ldpdcount = $ldpdcount * $spandepth;
                if ($raidlevel < 10) {
                    $raidlevel = $raidlevel . "0";
                }
            }

            $result .= "//Adaptor $adp/Volume $ld/RAID-$raidlevel/$ldpdcount drives/$size$unit/$state";

        } #LDISK
        close LDINFO;

        # Get info on physical disks for this adapter
        open (PDLIST, "$megacli -PdList  -a$adp $megapostopt |")
            || exitreport('UNKNOWN', "error: Could not execute $megacli -PdList -a$adp $megapostopt ");

        my ($slotnumber,$fwstate);
        PDISKS: while (<PDLIST>) {
            if ( m/Slot Number\s*:\s*(\d+)/ ) {
                $slotnumber = $1;
                $pdcount++;
            } elsif ( m/(\w+) Error Count\s*:\s*(\d+)/ ) {
                if ( $1 eq 'Media') {
                    $mediaerrors += $2;
                } else {
                    $othererrors += $2;
                }
            } elsif ( m/Predictive Failure Count\s*:\s*(\d+)/ ) {
                $prederrors += $1;
            } elsif ( m/Firmware state\s*:\s*(\w+)/ ) {
                $fwstate = $1;
                if ( $fwstate eq 'Hotspare' ) {
                    $hotsparecount++;
                } elsif ( $fwstate eq 'Online' ) {
                    # Do nothing
                } elsif ( $fwstate eq 'Unconfigured' ) {
                    # A drive not in anything, or a non drive device
                    $pdcount--;
                } elsif ( $slotnumber != 255 ) {
                    $pdbad++;
                    $status = 'CRITICAL';
                }
            } elsif (m/^Is Emergency Spare\s*: YES/) {
                $hotsparecount++;
            } elsif (m/^Is Commissioned Spare\s*: YES/) {
                $commhotsparecount++;
            }
        } #PDISKS
        close PDLIST;

        # Get BBUs status
        open (BBUSTATUS, "$megacli -AdpBbuCmd -GetBbuStatus -a$adp $megapostopt |")
                    || exitreport('UNKNOWN', "error: Could not execute $megacli -AdpBbuCmd -GetBbuStatus -a$adp $megapostopt");

        my ($bbustate, $bbutemp, $bbutempstatus, $bburep);
        BBUS: while (<BBUSTATUS>) {
             if ( m/Battery State\s*:\s*(\w+)/ ) {
                 $bbustate = $1;
                 $status = max_state($status, 'CRITICAL') if ( $bbustate ne 'Operational' );
             } elsif ( m/^Temperature:\s*(\d+)\s*(\w+)/ ) {
                 $bbutemp = "$1" . "$2";
             } elsif ( m/Temperature\s*:\s*(\w+)/ ) {
                 $bbutempstatus = $1;
                 $status = max_state($status, 'CRITICAL') if ( $bbutempstatus ne 'OK' );
             } elsif ( m/Pack is about to fail.*:\s*(\w+)/ ) {
                 $bburep = $1;
                 $status = max_state($status, 'CRITICAL') if ( $bburep eq 'Yes' );
             }
        } #BBUS

        $result .= "/BBU state: $bbustate/BBU temp status: $bbutempstatus($bbutemp)/BBU needs replacement: $bburep/";
        close BBUSTATUS;

    } #ADAPTER

    alarm(0);
};

$result .= "/Drives:$pdcount";

# Any bad disks?
if ( $pdbad ) {
        $result .= "/$pdbad Bad Drives";
}

my $errorcount = $mediaerrors + $prederrors + $othererrors;
# Were there any errors?
if ( $errorcount ) {
        $result .= "/($errorcount Errors)";
        if ( ( $mediaerrors > $mediaallow ) ||
             ( $prederrors > $predallow )   ||
             ( $othererrors > $otherallow ) ) {
# /JF!/ Disable that for the moment.
#               $status = max_state($status, 'WARNING');
        }
}

# Do we have as many hotspares as expected (if any)
if ( $hotspares ) {
        if ( $hotsparecount < $hotspares ) {
                $status = max_state($status, 'WARNING');
                $result .= "/Hotspare(s):$hotsparecount (of $hotspares, $commhotsparecount commisionned)";
        } else {
                $result .= "/Hotspare(s):$hotsparecount";
        }
}

my $elapsed = gettimeofday - $before;
$elapsed = sprintf("%6.2f", $elapsed);
$result .= "/ (in $elapsed seconds)";

#print "emgerging out of eval: $@\n";
#if ($@) {
    if ($@ =~ /timeout/) {
#        print "*** timeout popped up!\n";
        #timeout. do something here.
        exitreport('UNKNOWN', "plugin timeout after $timeout seconds");
    } else {
        alarm(0);   # clear still-pending alarm
#        print "yeah, no timeout!\n";
        exitreport($status, $result);
    }
#}
Since the plugin has to be run as root one must update the sudoers file to allow nagios to run only some very specific command options of the MegaCLI64 CLI.
nagios          tatania=(root) NOPASSWD: /usr/lib/nagios/plugins/
nagios          tatania=(root) NOPASSWD: /opt/lsi/MegaCli64 -adpCount -NoLog
nagios          tatania=(root) NOPASSWD: /opt/lsi/MegaCli64 -LdGetNum -a[[\:digit\:]]* -NoLog
nagios          tatania=(root) NOPASSWD: /opt/lsi/MegaCli64 -ShowSummary -a[[\:digit\:]]* -NoLog
nagios          tatania=(root) NOPASSWD: /opt/lsi/MegaCli64 -LdInfo -L[[\:digit\:]]* -a[[\:digit\:]]* -NoLog
nagios          tatania=(root) NOPASSWD: /opt/lsi/MegaCli64 -PdList -a[[\:digit\:]]* -NoLog
nagios          tatania=(root) NOPASSWD: /opt/lsi/MegaCli64 -AdpBbuCmd -GetBbuStatus -a[[\:digit\:]]* -NoLog
nagios          tatania=(root) NOPASSWD: /opt/lsi/MegaCli64 -EncStatus -a[[\:digit\:]]* -NoLog
nagios          ALL=(ALL) NOPASSWD: /usr/lib/nagios/plugins/
The passive service check is done using the following script running as a cronjob, every 20mins, on tatania. It will run the above plugin as root using sudo and if a service change is detected, will call send_nsca to notify Nagios.
#!/usr/bin/perl -w
#
#Developer: Mikhail Kniaziewicz
#Email: mikhail@ebusinessjuncture.com
#Purpose: Created container for check_load command to support NSCA passive check
#
#/JF!/ 20120206. Stuff to do:
#                   - Fix the temp file creation. Not secure.
#                   - There is a better way to keep state information between invacations.

use strict;
use lib qw(/usr/lib/nagios/plugins /usr/lib64/nagios/plugins); # possible pathes to your Nagios plugins and utils.pm
use utils qw(%ERRORS);

my $nagios_server = "nagios";
my $host=`/bin/hostname -f`;
my $send_nsca = "/usr/sbin/send_nsca";
my $nsca_cfg = "/etc/send_nsca.cfg";
my $svc="nsca_check_megaraid_sas";
my $state=0;
my $status="check_megaraid_sas.status";
# Careful: we will run this as nagios eventually, so use sudo.
my $check_cmd="sudo /usr/lib/nagios/plugins/check_megaraid_sas -s 6 -t 140";
#my $check_cmd="/root/sandbox/check_megaraid_sas-test -s 6 -t 140";
my $check_input = "";
my $check_output;
my @old_status;
my $old_status;

$|=1; #hot pipes

sub exitreport ($$) {
    my ($status, $message) = @_;

    print STDOUT "$status $message\n";
    exit $ERRORS{$status};
}

# Get the old status file. Create it if it doesn't exit.
chomp($host);
if ( ! -e $status ) {
    @old_status = ("$host", "$svc", "0", "Initialization...");
} else {
    open(OLDFILE, "<$status");
    $old_status = <OLDFILE>;
    @old_status=split(/\t/,$old_status);
}
close(OLDFILE);

# Run the nagios service check command and slurp it's output.
open(CMD, "$check_cmd $check_input |")
    or die "couldn't execute $check_cmd $check_input: $!";
while (<CMD>) {
    $check_output .= $_;
}
close CMD;
($state, my $dummy) = split(/ /, $check_output);
$state = $ERRORS{$state};

# For service checks, NSCA server wants to be sent a input tab separated string.
# <host_name>[tab]<svc_description>[tab]<return_code>[tab]<plugin_output>[newline]
# - $host must be the fqdn of the nsca sender.
# - $svc must match the service_description in the service command definition
# on the nagios server.
# - $state is 0,1,2 or 3.
# - $check_output is what nagios server will insert in the 'Status Information' field
# for this passive service check.
open (FH, ">$status") or die "cannot open status file $status: $!";
print FH "$host\t$svc\t$state\t$check_output\n";
close(FH);
# Only notify if there is a change in status and state is not normal.
if ($old_status[2] ne 0 || $state == 1 || $state == 2 || $state == 3){
#    print "system('/usr/sbin/send_nsca', '-H', '$nagios_server', '-c', '$nsca_cfg', '<', '$status');\n";
    system '/usr/sbin/send_nsca -H nagios -c /etc/send_nsca.cfg < check_megaraid_sas.status';
#    print "$send_nsca -H $nagios_server -c $nsca_cfg < $status\n";
}
exit (0);
This script will create a status file which is a tab-separated collection of strings:
tatania.bic.mni.mcgill.ca nsca_check_megaraid_sas 1 WARNING - //Adaptor 0/Volume 1/RAID-50/21 drives/33525GB/Optimal/BBU state: Operational/BBU temp status: OK(25C)/BBU needs replacement: No///Adaptor 1/Volume 0/RAID-50/21 drives/33525GB/Optimal/BBU state: Operational/BBU temp status: OK(24C)/BBU needs replacement: No//Drives:42/(6663 Errors)/Hotspare(s):5 (of 6, 1 commisionned)/ (in 5.71 seconds) @]
It is sent to Nagios by send_nsca unless when the plugin state changes and is not NORMAL.
I will change this behaviour as Nagios won’t receive any information if the state is NORMAL: there would be no way of differentiating between a script/cron failure or a more serious problem. That means that the host-bound status file is not necessary. Will recode that later.
Active Checks: How Do They Work?
Nagios is a strange beast and has a steep learning curve.
Lets’ say you have the following definition statements in the nagios config file /etc/nagios3/conf.d/BIC-hosts.cfg. It defines a host in the first and a service to be performed on it in the second one. The definitions use some templates use generic-host and use generic-service that are defined elsewhere and are not shown here. They set default values for notifications, etc.
define host{
    use                     generic-host
    host_name               cassio.bic.mni.mcgill.ca
    alias                   cassio
    address                 132.206.178.141
    check_command           check-host-alive
    max_check_attempts      20
    notification_interval   240
    notification_period     24x7
    notification_options    d,u,r
}

define service{
    use                     generic-service
    host_name               cassio.bic.mni.mcgill.ca
    service_description     Current Users
    check_command           check_me!check_users!60!100
    }
The define service{…} defines a service request to be performed on host_name cassio.bic.mni.mcgill.ca. The directive check_command will run the command check_me!check_users!60!100. This is parsed by Nagios using the delimiter ! as a suite of arguments $ARGn$, n=1,2,3…: $ARG1=check_users, $ARG2=60, $ARG3=100.
The command check_me must be defined somewhere else. In fact, in /etc/nagios3/conf.d/BIC-commands.cfg one finds:
# this command runs a program $ARG1$ with up to 6 arguments $ARGX$
define command{
   command_name    check_me
   command_line    /usr/lib/nagios/plugins/check_nrpe -H $HOSTADDRESS$ -c $ARG1$ -a $ARG2$ $ARG3$ $ARG4$ $ARG5$ $ARG6$ $ARG7$
}
OK, so what is happening here? Nagios will perform macro expansion on the command definition check_command
$HOSTADDRESS$macro is expended to be the value of theaddressin the host definition.$ARG*$are expended to be the arguments ofcheck_command, in sequence, ie:$ARG1 = check_users$ARG2 = 60$ARG3 = 100
So in the end the Nagios master will run the following:
/usr/lib/nagios/plugins/check_nrpe -H 132.206.178.141 -c check_users -a 60 100
check_nrpe is a Nagios plugin on the master that will contact the nrpe server on the remote host as referenced by the -H flag and attempt to run the command check_users and will pass it the arguments following the -a flag as $ARG1, $ARG2, $ARG3, etc.
Where is this check_users defined you are asking me? The remote nrpe server only knows commands that are defined in its configuration file /etc/nagios/nrpe.cfg. In that file one finds how check_users is to be invoked:
command[check_users]=/usr/lib/nagios/plugins/check_users -w $ARG1$ -c $ARG2$
So in the end the remote nrpe server will run:
/usr/lib/nagios/plugins/check_users -w 60 -c 100
and send back the command output to check_nrpe along with its return code and Nagios will be notified.
Service Dependencies
I have introduced a simple service dependencies scheme in order to lessen the amount of noise emitted by Nagios when TCP connectivity to a host is lost, ie, I know that if a host is down, the service checking its raid array will return a CRITICAL state, same for disk space usage, load averages, etc. generatting an avalanche of unnecesssary emails and alerts.
First, in /etc/nagios3/conf.d/BIC-services.cfg I define a master service for all hosts except the gateway (it makes no sense to include it: if you can’t get to it, might as well leave work and go for a pint).
# This introduces a 'master' service on each defined host (except 'gateway').
# The purpose of this service is to be the dependent service of all services
# checks that are done using tcp: if a host doesn't ping it's probably down
# and unreachable so it is useless for nagios to try and schedule active checks
# for the other services on that host using nrpe_nsca: they will fail. It's
# also useless and very annoying to receive tons of email and/or text message
# notifications when you know that a host is down.
# To achieve this one must defines the proper 'execution_failure_criteria'
# and 'notification_failure_criteria' directives in the 'servicedependency'
# definition in BIC-service-dependencies.cfg:
# Ie, dont schedule active service checks when the master service is warning, critical or unknown:
#       execution_failure_criteria      w,c,u
# Ie, dont send notifications for the depending services when the master service
# is warning, critical or unknown:
#        notification_failure_criteria   w,c,u

define service{
    use                     bic-generic-service
    host_name               *, !gateway
    service_description     Check host alive
    check_command           check-host-alive
    }
The check command check-host-alive is defined in /etc/nagios-plugins/config/ping.cfg as /usr/lib/nagios/plugins/check_ping -H’$HOSTADDRESS$’ -w 5000,100% -c 5000,100% -p 1
One then create the dependency between this service check and all the other TCP-based for a host. Using the proper combination of execution and notification failure criteria settings we can diminish the amout of noise created when a host is not reachable as if the master check-host-alive service checks returns a failure Nagios will not schedule a service check for the slave ones. Neat.
########################################################################
#
# Note:
#       The dependent_service_description directives defined below use
#       the negate sign'!' which means NOT <service description>.
#       There must be no space between it and the service description name.
#
########################################################################

########################################################################
### agrippa
########################################################################

define servicedependency{
    host_name                       agrippa.bic.mni.mcgill.ca
    service_description             Check host alive
    dependent_host_name             agrippa.bic.mni.mcgill.ca
    dependent_service_description   *, !Check host alive        ; match every thing but Check host alive.
    execution_failure_criteria      w,c,u                       ; disable exec when when master is w,c or u.
    notification_failure_criteria   w,c,u                       ; disable notify when master is wc or u.
    }
Nagios, SNMP Monitoring, Traps and Notifications
Here are some notes on how to configure Nagios to monitor SNMP network devices and process notifications (traps) from SNMP agents.
Assumptions:
- Everything, server side, is Debian/Linux-based.
- Nagios server is already configured and running.
Things to be done:
- Configure the SNMP agents.
- Setup Net-SNMP tools on the NMS.
- Verify manual access to the SNMP agents with the Net-SNMP tools.
- Configure Nagios to poll the SNMP agents.
- Configure Nagios to receive SNMP trap notifications
- Configure the Net-SNMP trap daemon and trap translator on the NMS to accept and process traps.
- Tidy up everything!
Facts before start:
- Network devices are TrippLite UPSs and PDUs equipped with SNMP network cards.
- Some of them are also fitted with EnviroSense probes for temperature and humidity readings.
- The SNMP agents support SNMP versions V1, V2C and V3.
- SNMP protocol V3 is disabled as the user-based Security module (USM), the View-Based Access Control Model (VACM) and the key management system still elude me!
- The NMS is the Nagios server itself.
- Only SNMP access protocol V2c is enabled.
- The SNMP devices are all located on the network 172.16.50.0/24.
- The NMS has an IP alias on this network and can talk to the agents. Verify with nmap.
- Great care should be exercized on limiting the access and probing of the SNMP agents!
- The SNMP agents should be configured to allow ‘read-only’ access from the NMS only.
- Cisco switches will be added in the future.
Make sure that your name space resolution is correctly configured. FQDN, short names, IP addresses should all resolve properly using the usual combination of nsswitch, /etc/hosts and/or DNS itself or whatever. Fix this before continuing! Otherwise strange things, hard to debug, will happen!
- Install the whole suite of Net-SNMP tools on the NMS along with some needed Perl modules and libraries:
ii  libnet-snmp-perl                  5.2.0-4                      Script SNMP connections
ii  libsnmp-base                      5.4.3~dfsg-2+squeeze1        SNMP (Simple Network Management Protocol) MIBs and documentation
ii  libsnmp-perl                      5.4.3~dfsg-2+squeeze1        SNMP (Simple Network Management Protocol) Perl5 support
ii  libsnmp-session-perl              1.13-1                       Perl support for accessing SNMP-aware devices
ii  libsnmp15                         5.4.3~dfsg-2+squeeze1        SNMP (Simple Network Management Protocol) library
ii  nagios-snmp-plugins               1.1.1-7                      SNMP Plugins for nagios
ii  snmp                              5.4.3~dfsg-2+squeeze1        SNMP (Simple Network Management Protocol) applications
ii  snmp-mibs-downloader              1.1                          Install and manage Management Information Base (MIB) files
ii  snmpd                             5.4.3~dfsg-2+squeeze1        SNMP (Simple Network Management Protocol) agents
ii  snmptrapfmt                       1.14                         A configurable snmp trap handler daemon for snmpd
ii  snmptt                            1.3-1                        SNMP trap handler for use with snmptrapd
TrippLite SNMP Web Cards
- Enable SNMP on the devices (turn them into agents).
- Disable the protocols V1 and V3 since they won’t be used.
- Setup the community name for V2c and make it ‘read only’.
- Restrict SNMP read-only access to the NMS only.
- Enable traps to be sent to the NMS using the
SNMPTRAPDcommunity string (See below to learn where this is set). - Choose which events should raise traps on the agents.
Some Possible Firmware Issues
- TrippLite PowerAlert firmware is at
v12.04.0055across the board except forpdu-a1–1which is atv12.06.0061. - TrippLite PowerAlert firmware
v12.06.006xhas issues with 64bit JRE plugins making the web interface almost unusable. - TRIPPLITE-MIB mib is consolidated for
v12.06.006x: some MIB OIDs dont translate forv12.04.0055. - A new firmware
v12.06.0064 RC1(June 2014) is apparently available. - UPDATE 20140910: just upgraded
pdu-a1–1fromv12.06.61tov12.06.64. Still darn slow as the previous version and some menus are still not usable…Is it really worth it to upgrade? Still not sure how to specify SNMP trap events and destinations.
MIBs Installation, Where to Get Them and Where to Install Them
- TrippLite support provides a MIB called TRIPPLITE-MIB that support all their line of SNMP cards. Nothing at the level of APC or Cisco AFAICS.
- The TrippLite MIB has an entry MODULE-IDENTITY DESCRIPTION: “Consolidated and Released for PAL
v12.06.006x”. - The Net-SNMP tools have a few MIBs loaded by default at compile time and expect to find MIBs on a few default dirs. Use the command
net-snmp-configto display them:
~# net-snmp-config --default-mibs
:UCD-DLMOD-MIB:UCD-DISKIO-MIB:LM-SENSORS-MIB:HOST-RESOURCES-MIB:HOST-RESOURCES-TYPES:IP-MIB:IF-MIB:TCP-MIB:UDP-MIB:
SNMPv2-MIB:RFC1213-MIB:NOTIFICATION-LOG-MIB:DISMAN-EVENT-MIB:DISMAN-SCHEDULE-MIB:UCD-SNMP-MIB:UCD-DEMO-MIB:
SNMP-TARGET-MIB:NET-SNMP-AGENT-MIB:SNMP-FRAMEWORK-MIB:SNMP-MPD-MIB:SNMP-USER-BASED-SM-MIB:SNMP-VIEW-BASED-ACM-MIB:
SNMP-COMMUNITY-MIB:IPV6-ICMP-MIB:IPV6-MIB:IPV6-TCP-MIB:IPV6-UDP-MIB:IP-FORWARD-MIB:NET-SNMP-PASS-MIB:
NET-SNMP-EXTEND-MIB:SNMP-NOTIFICATION-MIB:SNMPv2-TM:NET-SNMP-VACM-MIB

~# net-snmp-config --default-mibdirs
/root/.snmp/mibs:/usr/share/mibs/site:/usr/share/snmp/mibs:/usr/share/mibs/iana:/usr/share/mibs/ietf:/usr/share/mibs/netsnmp
- Stuff the MIBs in
/usr/share/mibs/site. By default, as displayed above, the Net-SNMP tools will look in there when searching for MIBS. - You can also put them in
~.snmp/mibsas the command above shows but that’s only good for a mere user with a shell. You then have to tell theNet-SNMPtools about them using the option-m +TRIPPLITE-MIB. Note that the argument is the MIB name, not the filename! - I found very old MIBs (1999!) from https://www.activexperts.com/admin/mib/Tripp-Lite/TRIPPUPS1-MIB. Note sure if they can be of any use with the SNMP Web cards from Tripplite.
- For the record, the TrippLite enterprise OID is
{ iso(1) org(3) dod(6) internet(1) private(4) enterprises(1) tripplite(850) }.
Using the Net-SNMP Tools on the NMS to Manually Access the Agents
- Use
snmpwalkto walk through the OIDs that the device supports. Using the TRIPPLITE-MIB MIB file will generate a very long output for TrippLite firmwarev12.04.0055— a few thousands lines — and much shorter for firmwarev12.06.0061:
snmpwalk -v2c -c tripplite pdu-a1-2 TRIPPLITE-MIB::tripplite

TRIPPLITE-MIB::tripplite.10.1.1.0 = INTEGER: 1
TRIPPLITE-MIB::tripplite.10.1.2.1.0 = IpAddress: 172.16.50.30
TRIPPLITE-MIB::tripplite.10.1.2.2.0 = INTEGER: 5
TRIPPLITE-MIB::tripplite.10.1.2.3.0 = STRING: "12.04.0055"

[...a few thousands lines later...]

TRIPPLITE-MIB::tlEnvTemperatureC.0 = INTEGER: 29
TRIPPLITE-MIB::tlEnvTemperatureF.0 = INTEGER: 85
TRIPPLITE-MIB::tlEnvTemperatureLowLimit.0 = INTEGER: 50
TRIPPLITE-MIB::tlEnvTemperatureHighLimit.0 = INTEGER: 95
TRIPPLITE-MIB::tlEnvTemperatureInAlarm.0 = INTEGER: false(2)
TRIPPLITE-MIB::tlEnvHumidity.0 = INTEGER: 29
TRIPPLITE-MIB::tlEnvHumidityLowLimit.0 = INTEGER: 15
TRIPPLITE-MIB::tlEnvHumidityHighLimit.0 = INTEGER: 75
TRIPPLITE-MIB::tlEnvHumidityInAlarm.0 = INTEGER: false(2)
TRIPPLITE-MIB::tlEnvContactIndex.1 = INTEGER: 1
TRIPPLITE-MIB::tlEnvContactIndex.2 = INTEGER: 2
TRIPPLITE-MIB::tlEnvContactIndex.3 = INTEGER: 3
TRIPPLITE-MIB::tlEnvContactIndex.4 = INTEGER: 4
TRIPPLITE-MIB::tlEnvContactName.1 = STRING: Contact Input #1
TRIPPLITE-MIB::tlEnvContactName.2 = STRING: Contact Input #2
TRIPPLITE-MIB::tlEnvContactName.3 = STRING: Contact Input #3
TRIPPLITE-MIB::tlEnvContactName.4 = STRING: Contact Input #4
TRIPPLITE-MIB::tlEnvContactStatus.1 = INTEGER: normal(0)
TRIPPLITE-MIB::tlEnvContactStatus.2 = INTEGER: normal(0)
TRIPPLITE-MIB::tlEnvContactStatus.3 = INTEGER: normal(0)
TRIPPLITE-MIB::tlEnvContactStatus.4 = INTEGER: normal(0)
TRIPPLITE-MIB::tlEnvContactConfig.1 = INTEGER: normallyOpen(0)
TRIPPLITE-MIB::tlEnvContactConfig.2 = INTEGER: normallyOpen(0)
TRIPPLITE-MIB::tlEnvContactConfig.3 = INTEGER: normallyOpen(0)
TRIPPLITE-MIB::tlEnvContactConfig.4 = INTEGER: normallyOpen(0)
- Use
snmptranslateto translate OIDs from literal rep to integer of vice versa :
~# snmptranslate -Td .1.3.6.1.4.1.850.101.1.1.1.0

tlEnvTemperatureC OBJECT-TYPE
  -- FROM	TRIPPLITE-MIB
  SYNTAX	Integer32
  MAX-ACCESS	read-only
  STATUS	current
  DESCRIPTION	"The ambient temperature (C)."
::= { iso(1) org(3) dod(6) internet(1) private(4) enterprises(1) tripplite(850) tlEnviroSense(101) tlEnvEnvironment(1) tlEnvTemperatureData(1) tlEnvTemperatureC(1) 0 }
- The MIB UPS-MIB will give you a more moderate output:
~# snmpwalk -OS -v2c -c tripplite ups-a2-1 UPS-MIB::upsMIB
UPS-MIB::upsIdentManufacturer.0 = STRING: Tripp Lite
UPS-MIB::upsIdentModel.0 = STRING: SU8000RT3UPM
UPS-MIB::upsIdentUPSSoftwareVersion.0 = STRING: 07
UPS-MIB::upsIdentAgentSoftwareVersion.0 = STRING: 12.04.0055
UPS-MIB::upsIdentName.0 = STRING: UPS-A2-1
UPS-MIB::upsIdentAttachedDevices.0 = STRING:
UPS-MIB::upsBatteryStatus.0 = INTEGER: batteryNormal(2)
UPS-MIB::upsSecondsOnBattery.0 = INTEGER: 0 seconds
UPS-MIB::upsEstimatedMinutesRemaining.0 = INTEGER: 42 minutes
UPS-MIB::upsEstimatedChargeRemaining.0 = INTEGER: 100 percent
UPS-MIB::upsBatteryVoltage.0 = INTEGER: 2700 0.1 Volt DC
UPS-MIB::upsBatteryTemperature.0 = INTEGER: 23 degrees Centigrade
UPS-MIB::upsInputLineBads.0 = Wrong Type (should be Counter32): INTEGER: 0
UPS-MIB::upsInputNumLines.0 = INTEGER: 1
UPS-MIB::upsInputLineIndex.1 = INTEGER: 1
UPS-MIB::upsInputFrequency.1 = INTEGER: 590 0.1 Hertz
UPS-MIB::upsInputVoltage.1 = INTEGER: 238 RMS Volts
UPS-MIB::upsOutputSource.0 = INTEGER: normal(3)
UPS-MIB::upsOutputFrequency.0 = INTEGER: 599 0.1 Hertz
UPS-MIB::upsOutputNumLines.0 = INTEGER: 1
UPS-MIB::upsOutputLineIndex.1 = INTEGER: 1
UPS-MIB::upsOutputVoltage.1 = INTEGER: 240 RMS Volts
UPS-MIB::upsOutputCurrent.1 = INTEGER: 6 0.1 RMS Amp
UPS-MIB::upsOutputPower.1 = INTEGER: 1376 Watts
UPS-MIB::upsOutputPercentLoad.1 = INTEGER: 19 percent
UPS-MIB::upsBypassFrequency.0 = INTEGER: 600 0.1 Hertz
UPS-MIB::upsBypassNumLines.0 = INTEGER: 1
UPS-MIB::upsBypassLineIndex.1 = INTEGER: 1
UPS-MIB::upsBypassVoltage.1 = INTEGER: 238 RMS Volts
UPS-MIB::upsAlarmsPresent.0 = Wrong Type (should be Gauge32 or Unsigned32): INTEGER: 1
UPS-MIB::upsAlarmId.1 = INTEGER: 1
UPS-MIB::upsAlarmDescr.1 = Wrong Type (should be OBJECT IDENTIFIER): STRING: "On Battery"
UPS-MIB::upsAlarmTime.1 = Wrong Type (should be Timeticks): INTEGER: 817013952
- To extract a specific value:
~# snmpget -OS -v2c -c tripplite ups-a2-1 UPS-MIB::upsOutputCurrent.1
UPS-MIB::upsOutputCurrent.1 = INTEGER: 6 0.1 RMS Amp
- Alright! We are set to go as we can get/read and walk the MIBs OIds trees from the SNMP agents.
Do not proceed further until you can manually access the devices using the Net-SNMP tools: if you can’t, Nagios won’t either!
Manually Polling SNMP Devices with Nagios
- Nagios uses a generic plugin called
check_snmpto access SNMP-aware devices. - It is located in
/usr/lib/nagios/plugins/check_snmp. - Let’s see if we can manually do the job. On the NMS, retrieve the temp on a PDU with EnviroSense probe and the battery temp of a UPS:
~# /usr/lib/nagios/plugins/check_snmp -H pdu-a1-1 --protocol=2c --community=tripplite \
                                                  --oid=TRIPPLITE-MIB::tlEnvTemperatureC.0 \
                                                  --units=C --warning=32 --critical=37
SNMP OK - 25 C | TRIPPLITE-MIB::tlEnvTemperatureC.0=25

~# /usr/lib/nagios/plugins/check_snmp -H ups-a4-2 --protocol=2c --community=tripplite \
                                                  --oid=UPS-MIB::upsBatteryTemperature.0 \
                                                  --units=C --warning=32 --critical=37
SNMP OK - 17 C | UPS-MIB::upsBatteryTemperature.0=17
- Success! Let’s setup Nagios to automagically do the job for us.
Nagios Service Definition for SNMP Access
- Create two hostgroups that contain all the SNMP devices. In our case, we have PDUs and UPSs from TrippLite.
- First define members in
/etc/nagios3/conf.d/BIC-hosts.cfg. One definition for each entity, eg:
########################################################################
### pdu-a1-1
########################################################################
define host{
    use                     bic-generic-host
    host_name               pdu-a1-1
    alias                   pdu-a1-1
    address                 172.16.50.31
    check_command           check-host-alive
    max_check_attempts      5
    notification_interval   240
    notification_period     24x7
    notification_options    d,u,r
    contact_groups          bicadmin,texters
}
- Then create the hostgroups in
/etc/nagios3/conf.d/BIC-hostgroups.cfg
define hostgroup {
    hostgroup_name      tripplite-pdus
    alias               TRIPPLITE PDUs
    members             pdu-a1-1, \
                        pdu-a1-2, \
                        pdu-a2-1, \
                        pdu-a2-2, \
                        pdu-a3-1, \
                        pdu-a3-2, \
                        pdu-a4-1, \
                        pdu-a4-2, \
                        pdu-a5-1, \
                        pdu-a5-2
}

define hostgroup {
    hostgroup_name      tripplite-ups
    alias               TRIPPLITE UPSs
    members             ups-a2-1, \
                        ups-a2-2, \
                        ups-a4-1, \
                        ups-a4-2
}
- Define the SNMP command
check_snmpin/etc/nagios3/conf.d/BIC-commands.cfg.
define command{
    command_name    check_snmp
    command_line    $USER1$/check_snmp -H $HOSTADDRESS$ --protocol=$ARG1$ --community=$ARG2$ \
                                       --oid=$ARG3$ --units=$ARG4$ --warning=$ARG5$ --critical=$ARG6$
}
/etc/nagios3/conf.d/BIC-hosts.cfgincludes definitions needed to check that network entities are alive./etc/nagios3/conf.d/BIC-services.cfgshown below includes services definitions needed to SNMP-poll the network entities.- Use the service template
/etc/nagios3/conf.d/bic-generic-service. - Reported value units from agents are forced to be in Celsius (it is not the default — stupid Americans!).
- Sets the warning and critical values to 32C and 37C respectively.
- Assumes all probes are in a similar environment in terms of temperature readings.
# check temperature values around the TrippLite PDUs and in the UPS' equipped with SNMP cards.
# Stupid tripplite UPS SNMP card without EnviroSense probes reports temperature only in Fahrenheit.
# Stupid Americans.
# Thus use 2 service definitions, one for units with EnviroSense probes, and those without.
# For units without EnviroSense probes use the OIDs from UPS-MIB for the battery temperature in C.
# (The TRIPPLITE-MIB only defines battery temperature in Fahrenheit which it gets from UPS-MIB::upsBatteryTemperature!)
define service {
    hostgroup_name          tripplite-pdus
    service_description     EnviroSense Probe Temperature
    use                     bic-generic-service
    check_command           check_snmp!2c!tripplite!TRIPPLITE-MIB::tlEnvTemperatureC.0!C!32!37
    contact_groups          bicadmin,texters
    notification_interval   0 ; minutes, set > 0 if you want to be renotified
}
define service {
    hostgroup_name          tripplite-ups
    service_description     UPS Battery Temperature
    use                     bic-generic-service
    check_command           check_snmp!2c!tripplite!UPS-MIB::upsBatteryTemperature.0!C!32!37
    contact_groups          bicadmin,texters
    notification_interval   0 ; minutes, set > 0 if you want to be renotified
}
- Community name should be modified to reflect the SNMP agents configuration. AGAIN, DO NOT USE PUBLIC!!!
- Assumes the agents are all configured the same way. If not then a number of different services for different devices will have to be defined.
- Here is what the Nagios Web interface displays for the services on the hostgroups
tripplite-pdusandtripplite-upswhen the above SNMP services are defined and Nagios has had time to update its status and poll all the SNMP agents. - Disregard the
TRAPentries for the moment, they will be explained later!
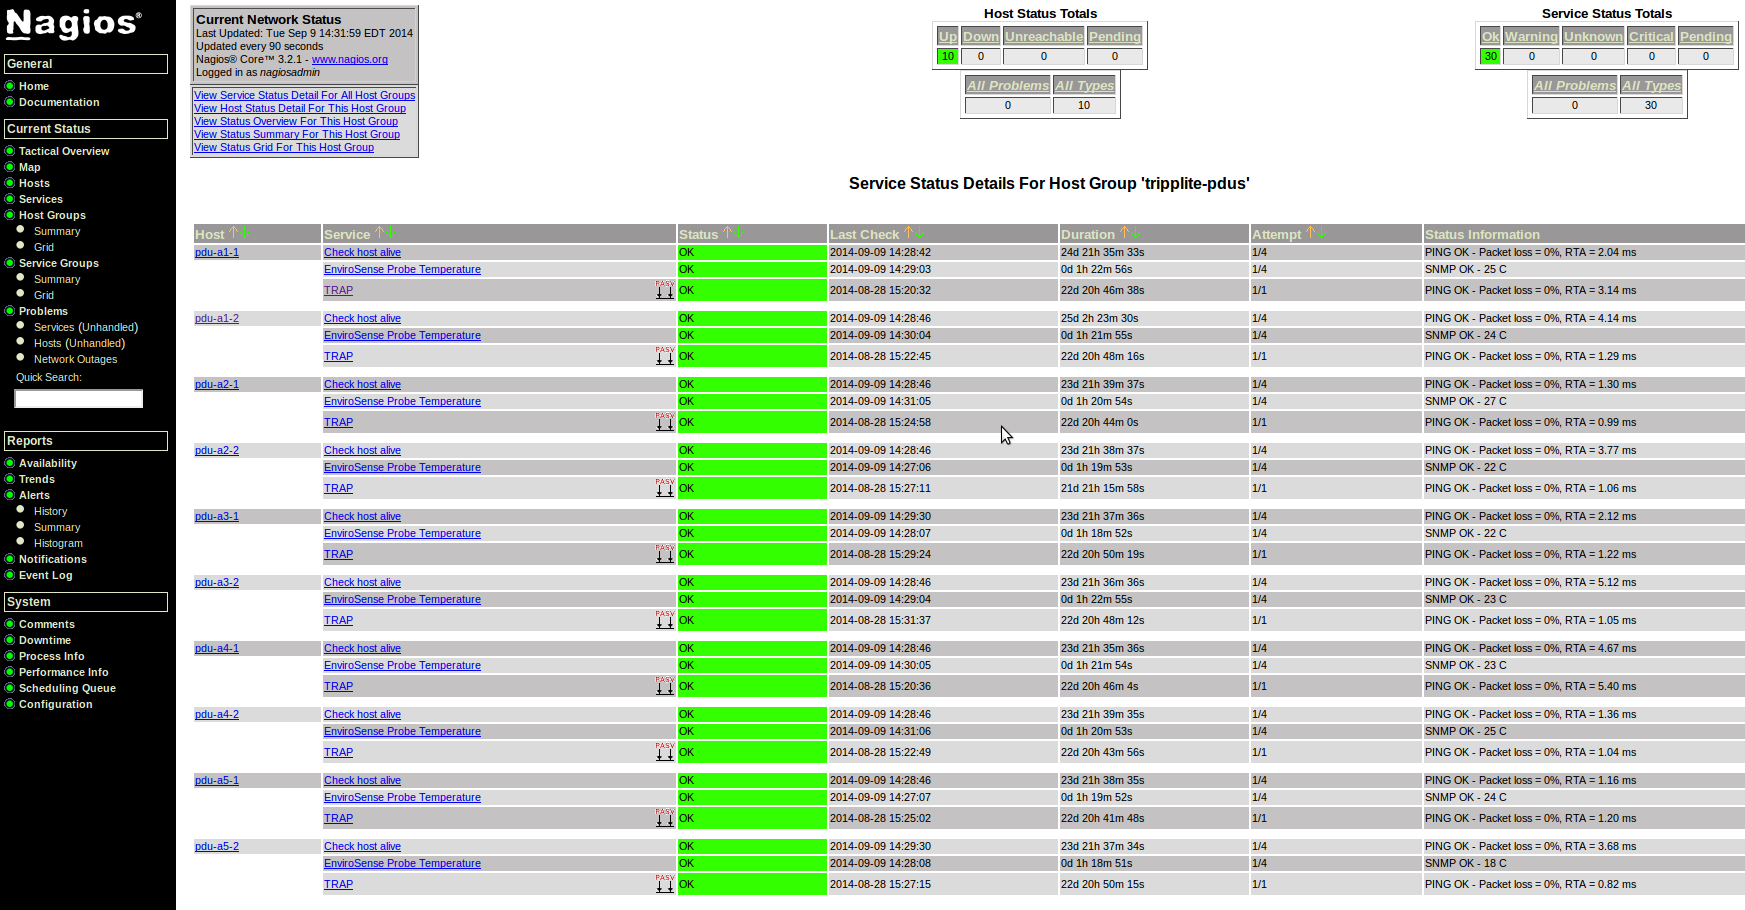
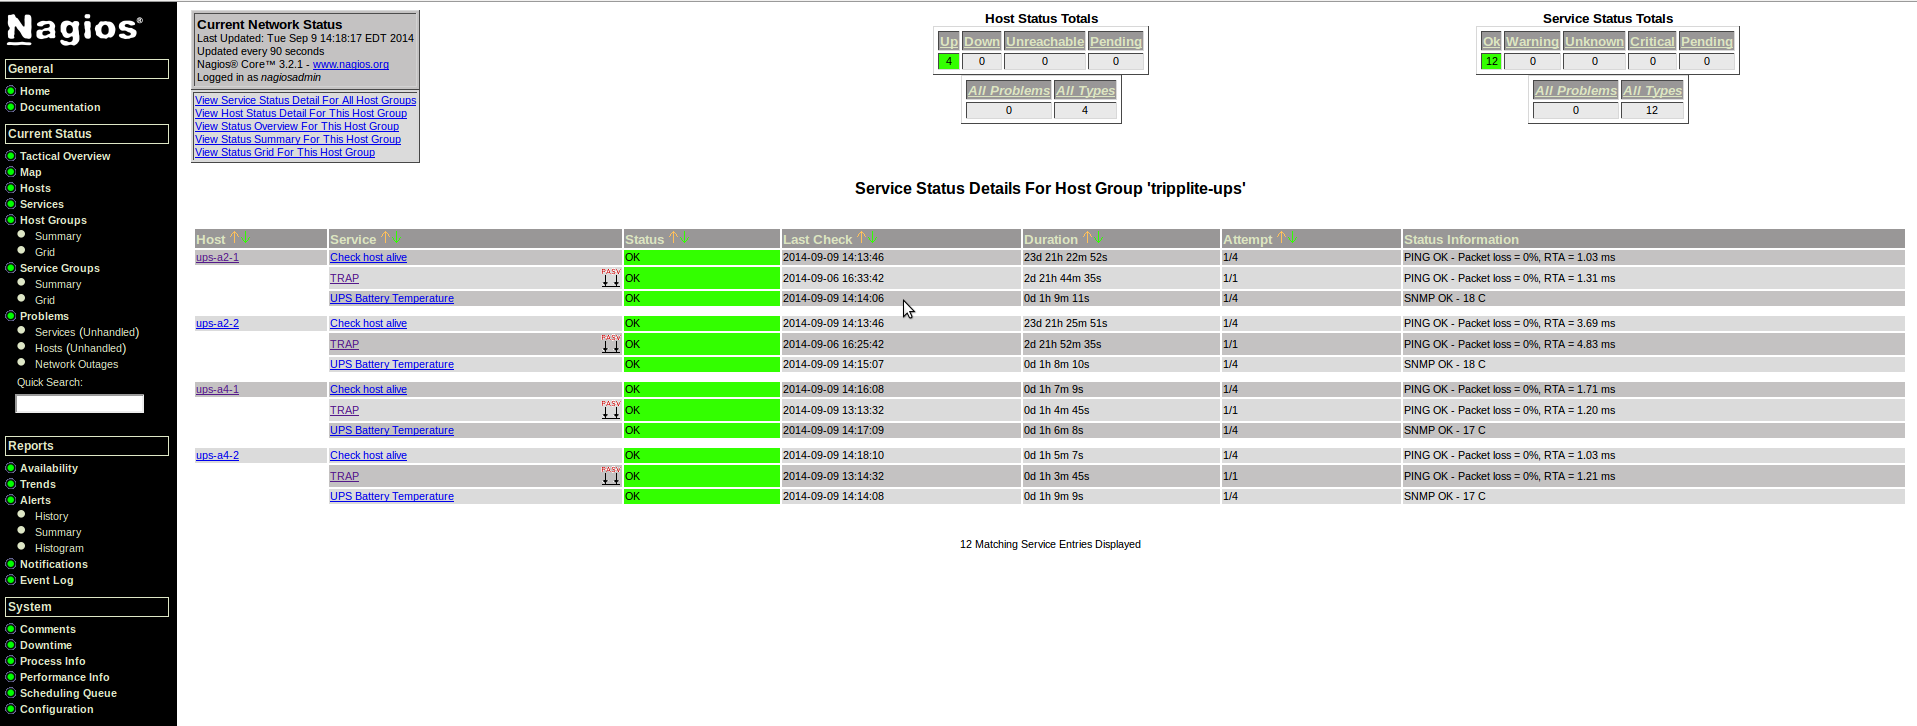
Enabling Nagios Notifications of Trap Events
- A little bit more complex than polling.
- Involves a few Net-SNMP tools and their configuration, the trap daemon acceptor itself,
SNMPTRAPD, the trap translatorSNMPTTand its associated trap translator handlerSNMPTTHANDLER. - Also involves using Nagios passive events queue handler which requires a strict syntax to work properly.
- There are issues with ownerships and permissions as Net-SNMP and Nagios have different security models.
The steps involved are:
- Setup a Nagios service template and service proper as explained in the case of polling.
- Enable traps on the SNMP agents.
- Download and install the required MIBs.
- Configure the SNMP trap daemon acceptor
snmptrapd. - Convert the MIBs with
snmpttconvertmib. - Configure the SNMP trap translator
snmptt. - Test it works! Setup a host to simulate a trap event.
Nagios SNMP_TRAP service template and TRAP service
- Define a generic service template called
SNMP_TRAPin/etc/nagios3/conf.d/BIC-services-generic-snmp.cfg.
# Stolen from http://paulgporter.net/2013/09/16/nagios-snmp-traps/
# This sets up a template for SNMP traps capture.
define service {
    name                            SNMP_TRAP
    service_description             SNMP_TRAP
    active_checks_enabled           0       ; Active service checks are disabled
    passive_checks_enabled          1       ; Passive service checks are enabled/accepted
    parallelize_check               1       ; Active service checks should be parallelized
    obsess_over_service             0       ; We should obsess over this service (if necessary)
    check_freshness                 0       ; Default is to NOT check service 'freshness'
    notifications_enabled           1       ; Service notifications are enabled
    event_handler_enabled           1       ; Service event handler is enabled
    flap_detection_enabled          1       ; Flap detection is enabled
    process_perf_data               1       ; Process performance data
    retain_status_information       1       ; Retain status information across program restarts
    retain_nonstatus_information    1       ; Retain non-status information across program restarts
    check_command                   check-host-alive      ; This will be used to reset the service to "OK"
    is_volatile                     1
    check_period                    24x7
    max_check_attempts              1
    normal_check_interval           1
    retry_check_interval            1
    notification_interval           31536000 ; One year! Prevents from getting pages of previously received traps
    notification_period             24x7
    notification_options            w,u,c    ; Recovery is not enabled so we do not get notified when a trap is cleared
    contact_groups                  bicadmin,texters       ; Modify this to match your Nagios contact group definitions
    register                        0       ; DONT REGISTER THIS DEFINITION - ITS NOT A REAL SERVICE, JUST A TEMPLATE!
}
A few remarks about this template:
- The service is
volatile. In general Nagios won’t notify contacts if a service that was in a NON-OK state is still in the same state after another check. But because there is only one service for the SNMP traps we setis_volatileso that contacts WILL be notified if another trap is received. - The
check_command check-host-aliveallows us to reset the state to OK by forcing an immediate recheck of the service thru the GUI. - One other option: from the command line, manually stuff the passive command queue event using
/usr/share/nagios3/plugins/eventhandlers/submit_check_result - The
notification_periodis set to 1 year(!). In that time no notification will be sent if the service state is still non-OK. Seeis_volatileabove. - There will not be notifications sent upon a service state recovery (
notification_options) - Its not clear if flap detection should be enabled: with
active_checks_enabledset to 0 how will Nagios ever got rid of flapping in the case of multiple traps occuring in short time span? Remember that if a service is flapping, contacts notifications are disabled. This will require further testing. - NOTE 20140914. I have re-enabled notifications on recovery (
notification_options w,u,c,rabove) for the simple reason that SNMP agents will send traps when alarms are removed from their alarm table. Might as well catch them! Also, as explained later in the section on the SNMP Trap Translator (SNMPTT), the EXEC statement in itssnmptt.confconfig file should reflect that fact and send the return codeOK(0)to the Nagios event queue handler. This is explained below in more details. - Define the real services in
/etc/nagios3/conf.d/BIC-services-snmp.cfg.
define service {
    use                 SNMP_TRAP
    hostgroup_name      tripplite-pdus,tripplite-ups
    service_description TRAP
    check_interval      120 ; Don't clear for 2 hours
}
define service {
    use                 SNMP_TRAP
    host_name           tatania.bic.mni.mcgill.ca
    service_description TRAP
    check_interval      120 ; Don't clear for 2 hours
    contact_groups      only-me,texters
}
- The service defined for host
tataniawill be used later to simulate a V2c trap event withsnmptrapto verify that they are effectively captured by the SNMP trap daemon on the NMS and sent to Nagios’ passive event collector and trigger notifications as configured in the service. - I also added
172.16.50.8(tatania IP address on the172.16.50.0/24network) to further verify that traps sent on this network are captured and processed by the NMS and Nagios server.
Please note the above service_description is named TRAP. It is very important to remember that this is what the Nagios passive event handler expects to be shoved in its event queue when an asynchronous SNMP event occurs: ANYTHING ELSE WILL BE SILENTLY DISCARDED. You have been warned!
We will come back to this later when we convert the MIBs traps with the command SNMPTTCONVERTMIB to allow SNMPTT to process them. Stay tuned.
Enabling Traps on the SNMP devices
- Configure SNMP entities to send traps to NMS using its IP address, the trap daemon port number (default 162) and the appropriate trap community string.
- Idea is to have only very important events to trigger traps/notifications.
- Do not duplicate the SNMP polling services already defined earlier: they can be expensive in terms of resources usage, both network-wise and on the NMS (MIBs access, OIDs literal/numeral translations, DNS/host lookups, etc).
- Trap candidates: UPS input failing, battery depletion, output over-load, etc.
- Enabling traps is obviously dependant on the SNMP agent itself and its vendor interface design, a CLI or web interface. YMMV.
- The TrippLite web UI for FW > 12.06.006x uses java plugins and there seem to be a few problems with it, at least with using
chromeversion ‘32.0.1700.77’, IcedTea-Web Plugin ‘1.4’ and java version ‘1.7.0_25’ (OpenJDK Runtime Environment (IcedTea 2.3.10) (7u25–2.3.10–1~deb7u1)). - Community string used to authenticate the trap sender is set by
AuthCommunityand is defined in/etc/snmp/snmptrapd.confon the NMS. - NMS must be made aware of the vendor/enterprise MIBs so that it can raise an exception when it receives a trap and send a notification with a meaningful error message. Otherwise the trap is just blindly discarded.
- TrippLite EnviroSense probes dont seem to have traps defined in the TRIPPLITE-MIB mib but the web interface has hooks to enable them. Strange.
Configuring SNMPTRAPD, the SNMP Trap Collector Daemon
- Verify the content of the file
/etc/default/snmpdand turn offsnmpd: no need for it unless the NMS is to be an SNMP agent itself. - Only requirement is the trap daemon SNMPTRAPD.
- Is the option
-On(display OIDs numerically) really needed inTRAPDOPTS? Not sure, maybe there is an overhead resolving OIDs… - From http://snmptt.sourceforge.net/docs/snmptt.shtml on the Unix installation, standard handler, it it is said:
9. Start snmptrapd using the command line: snmptrapd -On.
The -On is recommended. This will make snmptrapd pass OIDs in numeric form and prevent SNMPTT from having to translate the symbolic name to numerical form. If the UCD-SNMP / Net-SNMP Perl module is not installed, then you MUST use the -On switch. Depending on the version of UCD-SNMP / Net-SNMP, some symbolic names may not translate correctly. See the FAQ for more info.
As an alternative, you can edit your snmp.conf file to include the line: printNumericOids 1. This setting will take effect no matter what is used on the command line.
- This being said, here is the
/etc/default/snmpdfile:
/etc/default/snmpd

# This file controls the activity of snmpd and snmptrapd

# Don't load any MIBs by default.
# You might comment this lines once you have the MIBs downloaded.
#export MIBS=/usr/share/mibs

# snmpd control (yes means start daemon).
SNMPDRUN=no

# snmpd options (use syslog, close stdin/out/err).
SNMPDOPTS='-Lsd -Lf /dev/null -u snmp -g snmp -I -smux -p /var/run/snmpd.pid'

# snmptrapd control (yes means start daemon).  As of net-snmp version
# 5.0, master agentx support must be enabled in snmpd before snmptrapd
# can be run.  See snmpd.conf(5) for how to do this.
TRAPDRUN=yes

# snmptrapd options (use syslog).
TRAPDOPTS='-Lsd -p /var/run/snmptrapd.pid'

# create symlink on Debian legacy location to official RFC path
SNMPDCOMPAT=yes
- The SNMP trap daemon config on the NMS lives in
/etc/snmp/snmptrapd.conf. - Restart the trap daemon upon making changes:
/etc/init.d/snmpd restart.
Double check that the SNMPTRAPD daemon is restarted correctly, sometimes it doesn’t!
- We now configure the Net-SNMP
snmptrapdtrap acceptor daemon in/etc/snmp/snmptrapd.conf
/etc/snmp/snmptrapd.conf

###############################################################################
#
# EXAMPLE-trap.conf:
#   An example configuration file for configuring the Net-SNMP snmptrapd agent.
#
###############################################################################
#
# This file is intended to only be an example.  If, however, you want
# to use it, it should be placed in /etc/snmp/snmptrapd.conf.
# When the snmptrapd agent starts up, this is where it will look for it.
#
# All lines beginning with a '#' are comments and are intended for you
# to read.  All other lines are configuration commands for the agent.

#
# PLEASE: read the snmptrapd.conf(5) manual page as well!
#

authCommunity log,execute,net public
#/JF/ First, match the Tripplite OIDs traps only
# -- iso(1) org(3) dod(6) internet(1) private(4) enterprises(1) tripplite(850)
#
# Tell the trap translator to call the nagios passive event handler
# (this is done in /etc/snmp/snmptt.conf) by converting the MIB with:
# snmpttconvertmib --in=/usr/share/mibs/site/TRIPPLITE-MIB --out=/etc/snmp/snmptt.conf --debug \
#                  --exec='/usr/share/nagios3/plugins/eventhandlers/submit_check_result $r TRAP 2'

# TRIPPLITE-MIB::tripplite
traphandle .1.3.6.1.4.1.850.* /usr/sbin/snmptthandler

# UPS-MIB::upsMIB
traphandle .1.3.6.1.2.1.33.*  /usr/sbin/snmptthandler

#/JF/ ... anything else not matched above will continue here.
#         send trap notification by email to bicadmin:
traphandle default /usr/bin/traptoemail -s smtphost.bic.mni.mcgill.ca -f snmp@matsya bicadmin
A few comments about the above:
authCommunitydefines which type of processing is allowed and specifies the community name used to authenticate incoming traps. Please do not use public! Change it!- The
traphandlewill invoke thesnmptthandlerwhenever an incoming trap matches the OID token. - The OID tokens can contain wildcard suffixes
*but be careful those are NOT regex ie.1.3.6.1.4.1.*.10.8.*is not a valid OID token. - Not sure how it deals with literal OIDs: case dependant? translate them first in numeric? Investigate.
- Multiple instances of
traphandleare allowed. First match wins. - If the
SNMPTTtrap translator is is daemon mode, usesnmptthandler, otherwize usesnmptt. - The
snmptthandlerdumps the captured traps in a spool directory whereSNMPTTdaemon will process them.
Converting the MIBs for the Trap Tranlator SNMPTT
- Before going on with
snmpttand its configuration one must convert the trap notification definitions from the MIBs (those with ASN.1 Object Type NOTIFICATION-TYPE). - Upon receiving a trap PDU a few things must be in place for
snmpttto do its thing: - First,
snmptrapdmust find a match as defined in one of thetraphandlestanza insnmptrapd.conf. - In case of a match
snmptthandlerwill be invoked. - In turn
snmptthandlerwill do its own processing (first, it will readsnmptt.inifile, then slurp its STDIN for arguments, etc) and then create a spool file forsnmpttto process. - The
snmpttdaemon will grab the spool file and start working on it. snmpttmust be made aware of which traps are defined for processing and disposal, if any at all.- This is where the
/etc/snmp/snmptt.confcomes into play. - It is usually created using the command
snmpttconvertmibthe following way for example:
snmpttconvertmib --in=/usr/share/mibs/site/TRIPPLITE-MIB --out=/etc/snmp/snmptt.conf --debug \
                  --exec='/usr/share/nagios3/plugins/eventhandlers/submit_check_result $r TRAP 2'
/etc/snmp/snmptt.confcan be tuned manually evidently. Actually, it must, as the above command will only send to CRITICAL(2) state events to Nagios queue event handler. More on this below./etc/snmp/snmptt.confcontains a list of all defined traps and must contain at least one EVENT and FORMAT lines for each trap.- See http://snmptt.sourceforge.net/docs/snmptt.shtml#SNMPTT.CONF-MATCH for all the gory details.
Notice in the command snmpttconvertmib above the argument in the -exec option above: TRAP 2. IT IS OF THE UTMOST IMPORTANCE TO HAVE THIS RIGHT!
TRAP is the service name description as defined in the Nagios passive snmp service definition. Nagios will silently drop any passive event queue request that is not defined in its configuration files. IT HAS TO BE AN EXACT MATCH.
The integer 2 above is the return code value for a CRITICAL notification in Nagios speak. 0=OK, 1=WARNING, 2=CRITICAL, 3=UNKNOWN.
Finally the $r variable will be substituted by SNMPTT (refer to the link above for a list of all possible variable substitutions). Bottom line, $r will be substituted by the hostname of the trap sender. Again be careful here as this value should be the fqdn of the host and it must match the hostname defined in the Nagios service definition. Double check your DNS/name resolution setup!
- For example, the TRIPPLITE-MIB mib file was converted to test the simulated trap event and this corresponding entry in the file was generated:
MIB: TRIPPLITE-MIB (file:/usr/share/mibs/site/TRIPPLITE-MIB) converted on Mon Aug 18 15:00:35 2014 using snmpttconvertmib v1.3
#
#
#
EVENT tlUpsTrapAlarmEntryAddedV1 .1.3.6.1.4.1.850.100.2.0.3 "Status Events" WARNING
FORMAT UPS Alarm: $7 - $3.
EXEC /usr/share/nagios3/plugins/eventhandlers/submit_check_result $r TRAP 2 "UPS Alarm: $7 - $3."
NODES /etc/snmp/snmptt-nodes
SDESC
This trap is sent each time an alarm is inserted into
to the alarm table.
Variables:
  1: tlUpsAlarmId
     Syntax="INTEGER"
     Descr="A unique identifier for an alarm condition."
  2: tlUpsAlarmDescr
     Syntax="OBJECTID"
     Descr="A description of the alarm condition."
  3: tlUpsAlarmDetail
     Syntax="OCTETSTR"
     Descr="A textual description of the alarm condition."
  4: tlUpsAlarmDeviceId
     Syntax="INTEGER"
     Descr="A numeric identifier for the device on which the alarm is active."
  5: tlUpsAlarmDeviceName
     Syntax="OCTETSTR"
     Descr="A string identifier for the device on which the alarm is active."
  6: tlUpsAlarmLocation
     Syntax="OCTETSTR"
     Descr="The location of the device on which the alarm is active."
  7: tlUpsAlarmGroup
     Syntax="INTEGER"
       1: critical
       2: warning
       3: info
       4: status
       5: offline
       6: custom
     Descr="The category/group of this alarm."
EDESC
The /etc/snmp/snmptt.conf above was augmented with the statement NODES /etc/snmp/snmptt-nodes: the EXEC statement will only proceed if the trap originates from a system listed in the file /etc/snmp/snmptt-nodes:
172.16.50.21 ups-a2-1
172.16.50.22 ups-a2-2
172.16.50.23 ups-a4-1
172.16.50.24 ups-a4-2
172.16.50.29 pdu-a2-1
172.16.50.30 pdu-a1-2
172.16.50.31 pdu-a1-1
172.16.50.34 pdu-a3-1
172.16.50.35 pdu-a3-2
172.16.50.36 pdu-a2-2
172.16.50.38 pdu-a4-1
172.16.50.39 pdu-a4-2
172.16.50.40 pdu-a5-1
172.16.50.41 pdu-a5-2
132.206.178.52 tatania.bic.mni.mcgill.ca
- Note that the
snmpttconvertmibcommand as shown above will create a/etc/snmp/snmptt.confconfig file whereby all traps received will trigger a NagiosCRITICALevent, even for cases where the trap is to signal a return to a healthy state. - To avoid this a specific match entry will have to be inserted or modified to prevent such a behavior, like the following for a trap sent when an alarm is removed from the alarm table for a TrippLite SNMPWEBCARD network device:
EVENT tlUpsTrapAlarmEntryRemovedV1 .1.3.6.1.4.1.850.100.2.0.4 "Status Events" WARNING
FORMAT UPS Alarm: $7 - $3.
#/JF!/ 20140906. Change the Nagios return state to OK(0) rather than CRITICAL(2) since this is a recovery from a previous alarm.
EXEC /usr/share/nagios3/plugins/eventhandlers/submit_check_result $r TRAP 0 "UPS Alarm: $7 - $3."
#/!FJ/

[...]
Configuring SNMPTT, the SNMP Trap Translator
snmpttconfig file is located in/etc/snmp/snmptt.ini. It is a long one.- Some remarks:
- The
snmpttis running in daemon mode but with root privileges because I can’t figure out how to allow it, when it runs as a non-privileged user, to access the Nagios passive event queue — which belongs to Nagios only (with group www-data allowed to read-write for the CGIs of the web interface to work). THIS MIGHT BE DANGEROUS!. - Enabling
daemon_uid = snmpttbelow make things fail silently, without even a whisper from Nagios, the EXEC simply disappears into thin air.
The most salient modifications I made to /etc/snmp/snmptt.ini are:
[General]
snmptt_system_name =
mode = daemon
resolve_value_ip_addresses = 0
net_snmp_perl_enable = 1
net_snmp_perl_best_guess = 2
translate_log_trap_oid = 0
translate_value_oids = 2
translate_enterprise_oid_format = 2
translate_trap_oid_format = 2
translate_varname_oid_format = 2
translate_integers = 1
mibs_environment = ALL
[DaemonMode]
daemon_fork = 1
#/JF/ tick.
#daemon_uid = snmptt
daemon_uid =
[Logging]
stdout_enable = 0
log_enable = 1
log_file = /var/log/snmptt/snmptt.log
log_system_enable = 1
log_system_file = /var/log/snmptt/snmpttsystem.log
unknown_trap_log_enable = 1
unknown_trap_log_file = /var/log/snmptt/snmpttunknown.log
statistics_interval = 0
syslog_enable = 1
syslog_facility = local0
[Exec]
exec_enable = 1
pre_exec_enable = 1
unknown_trap_exec =
unknown_trap_exec_format =
exec_escape = 1
[Debugging]
DEBUGGING = 2
DEBUGGING_FILE = /var/log/snmptt/snmptt.debug
DEBUGGING_FILE_HANDLER = /var/log/snmptt/snmptthandler.debug
[TrapFiles]
snmptt_conf_files = <<END
/etc/snmp/snmptt.conf
END
Test Test Test. Simulating a Trap Event
- Debugging is turned on both for
snmptthandlerandsnmptt. - Shown below are the typical log and debug entries when a UPS trap, simulated to originate from tatania, is sent to the NMS.
- The putative trap is a notification of a UPS having lost its input load and being on battery power.
- Look at the
UPS-MIBmib to make sense of thesnmptrapcommand arguments and their OIDs types. - The description of the OID can be extracted with
snmptranslateand the option-Td(seeman snmpcmd)
snmptranslate -Td UPS-MIB::upsTrapOnBattery
UPS-MIB::upsTrapOnBattery
upsTrapOnBattery NOTIFICATION-TYPE
  -- FROM	UPS-MIB
  OBJECTS	{ upsEstimatedMinutesRemaining, upsSecondsOnBattery, upsConfigLowBattTime }
  DESCRIPTION	"The UPS is operating on battery power.  This trap is
            persistent and is resent at one minute intervals until
            the UPS either turns off or is no longer running on
            battery."
::= { iso(1) org(3) dod(6) internet(1) mgmt(2) mib-2(1) upsMIB(33) upsTraps(2) 1 }
- Send the trap
Note: these are SMIv2 traps. Sending V1 traps with snmptrap requires a different syntax!
Check with tcpdump that the trap is sent to the NMS. Replace IP_OF_TRAP_SENDER and IP_OF_NMS with the IP addresses of the sender and receiver hosts.
~# tcpdump src host <IP_OF_TRAP_SENDER> and udp dst port 162 and dst host <IP_OF_NMS>
If the snmptrapd process on the NMS doesn’t detect it: is there a firewall that blocks UDP port 162! Open it up for the network that the sender is on:
~# iptables -I INPUT -s 172.16.50.0/23 -p udp --dport 162 -j ACCEPT
Here comes the trap:
~# snmptrap -v 2c -c public matsya '' UPS-MIB::upsTrapOnBattery \
                                      UPS-MIB::upsEstimatedMinutesRemaining i 5 \
                                      UPS-MIB::upsSecondsOnBattery i 30 \
                                      UPS-MIB::upsConfigLowBattTime i 2
- Another trap I tested to mimic a trap from a TrippLite UPS, using the mib TRIPPLITE-MIB::tripplite
~# snmptrap -v 2c -c public matsya '' TRIPPLITE-MIB::tlUpsTrapAlarmEntryAdded \
                                      TRIPPLITE-MIB::tlUpsAlarmId = 666 \
                                      TRIPPLITE-MIB::tlUpsAlarmDescr = "mm" \
                                      TRIPPLITE-MIB::tlUpsAlarmDetail = "detail" \
                                      TRIPPLITE-MIB::tlUpsAlarmDeviceId = "1" \
                                      TRIPPLITE-MIB::tlUpsAlarmDeviceName = "tlUpsAlarmDeviceName" \
                                      TRIPPLITE-MIB::tlUpsAlarmLocation = "tlUpsAlarmLocation" \
                                      TRIPPLITE-MIB::tlUpsAlarmGroup = 1

~# snmptranslate -Td TRIPPLITE-MIB::tlUpsTrapAlarmEntryAdded
TRIPPLITE-MIB::tlUpsTrapAlarmEntryAdded
tlUpsTrapAlarmEntryAdded NOTIFICATION-TYPE
  -- FROM	TRIPPLITE-MIB
  OBJECTS	{ tlUpsAlarmId, tlUpsAlarmDescr, tlUpsAlarmDetail, tlUpsAlarmDeviceId, tlUpsAlarmDeviceName, tlUpsAlarmLocation, tlUpsAlarmGroup }
  DESCRIPTION	"This trap is sent each time an alarm is inserted into
            to the alarm table."
::= { iso(1) org(3) dod(6) internet(1) private(4) enterprises(1) tripplite(850) tlUPS(100) tlUpsTraps(2) 3 }
- A lot of things are happening now!
- The
snmpttlog file/var/log/snmptt/snmptt.logshows that it got a trap handled to him bysnmptrapddaemon:
Tue Aug 19 00:26:21 2014 .1.3.6.1.2.1.33.2.1 Normal "Status Events" tatania.bic.mni.mcgill.ca - The UPS is operating on battery power. This trap is 5 30 2
- The
snmptthandlertrap handler got waken up bysnmptrapd: its debug file/var/log/snmptt/snmptthandler.debugshows:
SNMPTTHANDLER started: Tue Aug 19 00:26:21 2014

s = 1408422381, usec = 43437
s_pad = 1408422381, usec_pad = 043437

Data received:

tatania.bic.mni.mcgill.ca

UDP: [132.206.178.52]:49881->[132.206.178.240]

.1.3.6.1.2.1.1.3.0 18:11:36:47.94

.1.3.6.1.6.3.1.1.4.1.0 .1.3.6.1.2.1.33.2.1

.1.3.6.1.2.1.33.1.2.3 5

.1.3.6.1.2.1.33.1.2.2 30

.1.3.6.1.2.1.33.1.9.7 2
- And the
snmpttdebug file/var/log/snmptt/snmptt.debug
processing file: #snmptt-trap-1408422381043437
Reading trap.  Current time: Tue Aug 19 00:26:25 2014

Raw trap passed from snmptrapd:
1408422381
tatania.bic.mni.mcgill.ca
UDP: [132.206.178.52]:49881->[132.206.178.240]
.1.3.6.1.2.1.1.3.0 18:11:36:47.94
.1.3.6.1.6.3.1.1.4.1.0 .1.3.6.1.2.1.33.2.1
.1.3.6.1.2.1.33.1.2.3 5
.1.3.6.1.2.1.33.1.2.2 30
.1.3.6.1.2.1.33.1.9.7 2

Items passed from snmptrapd:
value 0: tatania.bic.mni.mcgill.ca

value 1: 132.206.178.52

value 2: .1.3.6.1.2.1.1.3.0

value 3: 18:11:36:47.94

value 4: .1.3.6.1.6.3.1.1.4.1.0

value 5: .1.3.6.1.2.1.33.2.1

value 6: .1.3.6.1.2.1.33.1.2.3

value 7: 5

value 8: .1.3.6.1.2.1.33.1.2.2

value 9: 30

value 10: .1.3.6.1.2.1.33.1.9.7

value 11: 2

Agent IP address was blank, so setting to the same as the host IP address of 132.206.178.52

Agent IP address (132.206.178.52) is the same as the host IP, so copying the host name: tatania.bic.mni.mcgill.ca

Trap received from tatania.bic.mni.mcgill.ca: .1.3.6.1.2.1.33.2.1
0:              hostname
1:              ip address
2:              uptime
3:              trapname / OID
4:              ip address from trap agent
5:              trap community string
6:              enterprise
7:              securityEngineID        (snmptthandler-embedded required)
8:              securityName            (snmptthandler-embedded required)
9:              contextEngineID         (snmptthandler-embedded required)
10:             contextName             (snmptthandler-embedded required)
0+:             passed variables

Value 0: tatania.bic.mni.mcgill.ca

Value 1: 132.206.178.52

Value 2: 18:11:36:47.94

Value 3: .1.3.6.1.2.1.33.2.1

Value 4: 132.206.178.52

Value 5:

Value 6:

Value 7:

Value 8:

Value 9:

Value 10:

Agent dns name: tatania.bic.mni.mcgill.ca

Ent Value 0 ($1): .1.3.6.1.2.1.33.1.2.3=5

Ent Value 1 ($2): .1.3.6.1.2.1.33.1.2.2=30

Ent Value 2 ($3): .1.3.6.1.2.1.33.1.9.7=2

Exact match of trap found in EVENT hash table

Working with EVENT entry: .1.3.6.1.2.1.33.2.1 => upsTrapOnBattery,Status Events,Normal,
  No nodes defined for this entry so all nodes will match
  No MATCH entries defined for this entry

Trap defined, processing...


PREEXEC line(s):


FORMAT line:

Variable .1.3.6.1.2.1.33.1.9.7 with value 2
  Value does not appear to contain an OID
  Value is numerical
  Value is defined as an INTEGER in the mib - will attempt to translate
    Could not translate

Variable .1.3.6.1.2.1.33.1.2.2 with value 30
  Value does not appear to contain an OID
  Value is numerical
  Value is defined as an INTEGER in the mib - will attempt to translate
    Could not translate

Variable .1.3.6.1.2.1.33.1.2.3 with value 5
  Value does not appear to contain an OID
  Value is numerical
  Value is defined as an INTEGER in the mib - will attempt to translate
    Could not translate

OID of received trap: .1.3.6.1.2.1.33.2.1.  Will attempt to translate to text
  Translated to UPS-MIB::upsTrapOnBattery
The UPS is operating on battery power.  This trap is 5 30 2

.1.3.6.1.2.1.33.2.1 Normal "Status Events" tatania.bic.mni.mcgill.ca - The UPS is operating on battery power.  This trap is 5 30 2


EXEC line(s):

Variable .1.3.6.1.2.1.33.1.9.7 with value 2
  Value does not appear to contain an OID
  Value is numerical
  Value is defined as an INTEGER in the mib - will attempt to translate
    Could not translate

Variable .1.3.6.1.2.1.33.1.2.2 with value 30
  Value does not appear to contain an OID
  Value is numerical
  Value is defined as an INTEGER in the mib - will attempt to translate
    Could not translate

Variable .1.3.6.1.2.1.33.1.2.3 with value 5
  Value does not appear to contain an OID
  Value is numerical
  Value is defined as an INTEGER in the mib - will attempt to translate
    Could not translate

OID of received trap: .1.3.6.1.2.1.33.2.1.  Will attempt to translate to text
  Translated to UPS-MIB::upsTrapOnBattery
EXEC command:/usr/share/nagios3/plugins/eventhandlers/submit_check_result tatania.bic.mni.mcgill.ca TRAP 2 "The UPS is operating on battery power.  This trap is 5 30 2"
- The very last line with the
EXECis the important one: a notification is sent to the Nagios passive check event queue. Not that I haven’t found a way of knowing if this exec calls succeed or not by looking at logs and debug files. I know it works because I get notified by email and cell phone text message. - Email notification from Nagios:
***** Nagios *****

Notification Type: PROBLEM

Service: TRAP
Host: tatania
Address: 132.206.178.52
State: CRITICAL

Date/Time: Tue Aug 19 16:39:19 EDT 2014

Additional Info:

The UPS is operating on battery power. This trap is 5 30 2
- Bingo! We are now in business!
A Real Trap Event
- After some anxious time wondering if the network entities on the TrippLite units were behaving as they should be — I even open a case support with TrippLite — or if I had made a mistake somewhere configuring Nagios, or even the SNMP NMS host or the network agents themselves, a trap event was finally generated! A warning from an expired battery due to a time fluctuation/hickup on the TrippLite UPS
ups-a2–1: the ntp engine on this ups is flacky and the agent localtime sometime jumps to 2036 when the ntp servers timeout or are unreachable, or something along this. - A trap on the agent for such an event was setup and one was generated (Aug 26th 2014): Nagios notified me. Yeah!
- A few things are noteworthy to notice about this trap.
- Looks like a SNMP trap version 1 was generated not a version 2.
- Look at the NMS syslog and SNMP log and debug files:
(the SNMP trap community string has been hidden to protect the under-aged and lines have been edited for ease of read)
/var/log/syslog
Aug 26 15:17:24 matsya snmptrapd[22203]: 2014-08-26 15:17:24 ups-a2-1 [172.16.50.21]
(via UDP: [172.16.50.21]:65440->[172.16.50.2]) TRAP, SNMP v1, community ********#012#011
SNMPv2-SMI::enterprises.850.100.2 Enterprise Specific Trap (3) Uptime: 174 days, 22:44:34.03#012#011
SNMPv2-SMI::enterprises.850.100.1.6.2.1.1 = INTEGER: 1#011
SNMPv2-SMI::enterprises.850.100.1.6.2.1.2 = OID: SNMPv2-SMI::mib-2.33.1.6.3.1#011
SNMPv2-SMI::enterprises.850.100.1.6.2.1.4 = STRING: "Battery Age Above Threshold"#011
SNMPv2-SMI::enterprises.850.100.1.6.2.1.5 = INTEGER: 1#011
SNMPv2-SMI::enterprises.850.100.1.6.2.1.6 = STRING: "UPS-A2-1"#011
SNMPv2-SMI::enterprises.850.100.1.6.2.1.7 = STRING: "Room WB212 Rack A2 Top"#011
SNMPv2-SMI::enterprises.850.100.1.6.2.1.8 = INTEGER: 3#011
SNMPv2-SMI::enterprises.850.100.1.6.2.1.9 = STRING: "172.16.50.21"#011
SNMPv2-SMI::enterprises.850.100.1.6.2.1.10 = STRING: "00:06:67:24:34:8a"#011
SNMPv2-SMI::enterprises.850.10.1.2.6 = STRING: "00:06:67:24:34:8a"

Aug 26 15:17:28 matsya snmptt[0]: .1.3.6.1.4.1.850.100.2.0.3 WARNING
"Status Events" ups-a2-1 - UPS Alarm: info - Battery Age Above Threshold.

Aug 26 15:17:40 matsya nagios3: EXTERNAL COMMAND: PROCESS_SERVICE_CHECK_RESULT;
ups-a2-1;TRAP;2;UPS Alarm: info - Battery Age Above Threshold.

Aug 26 15:17:46 matsya nagios3: PASSIVE SERVICE CHECK:
ups-a2-1;TRAP;2;UPS Alarm: info - Battery Age Above Threshold.

Aug 26 15:17:46 matsya nagios3: SERVICE ALERT:
ups-a2-1;TRAP;CRITICAL;HARD;1;UPS Alarm: info - Battery Age Above Threshold.

Aug 26 15:17:46 matsya nagios3: SERVICE NOTIFICATION:
malin-txt;ups-a2-1;TRAP;CRITICAL;notify-service-by-email;UPS Alarm: info - Battery Age Above Threshold.

Aug 26 15:27:10 matsya nagios3: EXTERNAL COMMAND: SCHEDULE_FORCED_SVC_CHECK; ups-a2-1;TRAP;1409081201
- The last entry above
EXTERNAL COMMAND: SCHEDULE_FORCED_SVC_CHECKis from using the web UI and forcing a service check — Nagios won’t recheck a service of its own as specified in the SNMP-TRAP template and TRAP service defintions. - One could also use the command line
/usr/share/nagios3/plugins/eventhandlers/submit_check_result ups-a2–1 TRAP 0 OKto reset the state.
/var/log/snmptt/snmptt.log
Tue Aug 26 15:17:25 2014 .1.3.6.1.4.1.850.100.2.0.3 WARNING "Status Events" ups-a2-1 - UPS Alarm: info - Battery Age Above Threshold.
/var/log/snmptt/snmptthandler.debug
SNMPTTHANDLER started: Tue Aug 26 15:17:25 2014

s = 1409080645, usec = 105780
s_pad = 1409080645, usec_pad = 105780

Data received:

ups-a2-1

UDP: [172.16.50.21]:65440->[172.16.50.2]

DISMAN-EVENT-MIB::sysUpTimeInstance 174:22:44:34.03

SNMPv2-MIB::snmpTrapOID.0 SNMPv2-SMI::enterprises.850.100.2.0.3

SNMPv2-SMI::enterprises.850.100.1.6.2.1.1 1

SNMPv2-SMI::enterprises.850.100.1.6.2.1.2 SNMPv2-SMI::mib-2.33.1.6.3.1

SNMPv2-SMI::enterprises.850.100.1.6.2.1.4 "Battery Age Above Threshold"

SNMPv2-SMI::enterprises.850.100.1.6.2.1.5 1

SNMPv2-SMI::enterprises.850.100.1.6.2.1.6 "UPS-A2-1"

SNMPv2-SMI::enterprises.850.100.1.6.2.1.7 "Room WB212 Rack A2 Top"

SNMPv2-SMI::enterprises.850.100.1.6.2.1.8 3

SNMPv2-SMI::enterprises.850.100.1.6.2.1.9 "172.16.50.21"

SNMPv2-SMI::enterprises.850.100.1.6.2.1.10 "00:06:67:24:34:8a"

SNMPv2-SMI::enterprises.850.10.1.2.6 "00:06:67:24:34:8a"

SNMP-COMMUNITY-MIB::snmpTrapAddress.0 172.16.50.21

SNMP-COMMUNITY-MIB::snmpTrapCommunity.0 "********"

SNMPv2-MIB::snmpTrapEnterprise.0 SNMPv2-SMI::enterprises.850.100.2
/var/log/snmptt/snmptt.debug
Processing file: #snmptt-trap-1409080645105780
Agent IP address (172.16.50.21) is the same as the host IP, so copying the host name: ups-a2-1

Trap received from ups-a2-1: SNMPv2-SMI::enterprises.850.100.2.0.3
Exact match of trap found in EVENT hash table

Working with EVENT entry: .1.3.6.1.4.1.850.100.2.0.3 => tlUpsTrapAlarmEntryAddedV1,Status Events,WARNING,
  No nodes defined for this entry so all nodes will match
  No MATCH entries defined for this entry

Trap defined, processing...


PREEXEC line(s):


FORMAT line:
UPS Alarm: info - Battery Age Above Threshold.

.1.3.6.1.4.1.850.100.2.0.3 WARNING "Status Events" ups-a2-1 - UPS Alarm: info - Battery Age Above Threshold.


EXEC line(s):
EXEC command:/usr/share/nagios3/plugins/eventhandlers/submit_check_result ups-a2-1 TRAP 2 "UPS Alarm: info - Battery Age Above Threshold."
LM-Sensors and SNMP polling with Nagios
- Using SNMP to poll cores temperatures with LM-Sensors requires a few things:
- Assume that lm-sensors have been configured and in a workable state.
- Debian pre-packaged Nagios plugin
check_snmp_env.pldoesn’t work, even if they advertize it does so. - Net-SNMP packaged version (5.4.3) on Debian/Squeeze and Wheezy are not at a sufficient level to allow the retrieval of the relevent OIDs tables from the lm-sensors.
- Apparently, Net-SNMP ≥ 5.5 is required.
check_snmp_temperature.pl and pass it the base OIDs of the tables containing the attribute names (‘Core 0, Core 1’…) and attribute data value lmMiscSensorsTable rather than lmTempSensorsTable. See the tree view below.
./check_snmp_temperature.pl -H jamy -C public -2 -N 1.3.6.1.4.1.2021.13.16.5.1.2 -D 1.3.6.1.4.1.2021.13.16.5.1.3 \
                            -a 'Core 0,Core 1,Core 2,Core 8,Core 9,Core 10' \
                            -w 81,81,81,81,81,81 -c 91,91,91,91,91,91 -i 1000C \
                            -A 'Core 0,Core 1,Core 2,Core 8,Core 9,Core 10' -f
OK - Core 0 Temperature is 28C, Core 1 Temperature is 30C, Core 2 Temperature is 25C, Core 8 Temperature is 26C, Core 9 Temperature is 29C,
Core 10 Temperature is 25C | Core 0=28;81;91 Core 1=30;81;91 Core 2=25;81;91 Core 8=26;81;91 Core 9=29;81;91 Core 10=25;81;91
- Compilation de Net-SNMP v5.7.2.1
- A few requirements:
apt-get install libperl-dev libsensors4-dev libwrap0-dev
- A few requirements:
configure --with-mib-modules='smux ucd-snmp/dlmod ucd-snmp/diskio ucd-snmp/lmsensorsMib host' --with-ldflags=-lsensors \
          --with-sys-contact=root --with-persistent-directory=/var/lib/snmp --with-sys-location=Unknown --with-libwrap \
          --with-mibdirs=/root/.snmp/mibs:/usr/share/mibs/site:/usr/share/snmp/mibs:/usr/share/mibs/iana:/usr/share/mibs/ietf\
           :/usr/share/mibs/netsnmp:/usr/local/share/snmp/mibs --with-defaults
- Compilation and installation steps to be done as root as when doing a
make installthe libtool command forces a relinking of some libraries and fails withpermission deniedif the configure/make steps are done as a mere user and install done as root. Very annoying! I’ve seen that a long time ago with Amanda and I have forgotten how to bypass this.
- Compilation and installation steps to be done as root as when doing a
- Remove the Net-SNMP Debian packages
apt-get remove snmp snmpd libsnmp15 libsnmp-base - Add a snmp user:
adduser —system —group —home /var/lib/snmp snmp - Create a basic snmpd config
/usr/local/share/snmp/snmpd.confwith the commandsnmpconf -i -g basic_setup - Start snmpd with
/usr/local/sbin/snmpd -Lsd -Lf /dev/null -u snmp -g snmp -I -smux -p /var/run/snmpd.pid - Check that one can walk the LM-SENSORS MIB from the NMS:
matsya:~# snmpwalk -v 2c -c public jupiter lmSensors
LM-SENSORS-MIB::lmTempSensorsIndex.1 = INTEGER: 1
LM-SENSORS-MIB::lmTempSensorsIndex.2 = INTEGER: 2
LM-SENSORS-MIB::lmTempSensorsIndex.3 = INTEGER: 3
LM-SENSORS-MIB::lmTempSensorsIndex.4 = INTEGER: 4
LM-SENSORS-MIB::lmTempSensorsIndex.5 = INTEGER: 5
LM-SENSORS-MIB::lmTempSensorsIndex.6 = INTEGER: 6
LM-SENSORS-MIB::lmTempSensorsIndex.7 = INTEGER: 7
LM-SENSORS-MIB::lmTempSensorsDevice.1 = STRING: Physical id 0
LM-SENSORS-MIB::lmTempSensorsDevice.2 = STRING: Core 0
LM-SENSORS-MIB::lmTempSensorsDevice.3 = STRING: Core 1
LM-SENSORS-MIB::lmTempSensorsDevice.4 = STRING: Core 2
LM-SENSORS-MIB::lmTempSensorsDevice.5 = STRING: Core 3
LM-SENSORS-MIB::lmTempSensorsDevice.6 = STRING: Core 4
LM-SENSORS-MIB::lmTempSensorsDevice.7 = STRING: Core 5
LM-SENSORS-MIB::lmTempSensorsValue.1 = Gauge32: 47000
LM-SENSORS-MIB::lmTempSensorsValue.2 = Gauge32: 42000
LM-SENSORS-MIB::lmTempSensorsValue.3 = Gauge32: 42000
LM-SENSORS-MIB::lmTempSensorsValue.4 = Gauge32: 42000
LM-SENSORS-MIB::lmTempSensorsValue.5 = Gauge32: 41000
LM-SENSORS-MIB::lmTempSensorsValue.6 = Gauge32: 40000
LM-SENSORS-MIB::lmTempSensorsValue.7 = Gauge32: 42000
- This is exactly the output the NagioSexChange
check_snmp_temperature.plplugin expects rather than the following from a host running Net-SNMPv5.4.3.
matsya:~# snmpwalk -v 2c -c public tatania lmSensors
LM-SENSORS-MIB::lmMiscSensorsIndex.1 = INTEGER: 0
LM-SENSORS-MIB::lmMiscSensorsIndex.2 = INTEGER: 1
LM-SENSORS-MIB::lmMiscSensorsIndex.3 = INTEGER: 2
...
LM-SENSORS-MIB::lmMiscSensorsIndex.48 = INTEGER: 47
LM-SENSORS-MIB::lmMiscSensorsDevice.1 = STRING: Core 0
LM-SENSORS-MIB::lmMiscSensorsDevice.2 = STRING: Core 0
LM-SENSORS-MIB::lmMiscSensorsDevice.3 = STRING: Core 0
...
LM-SENSORS-MIB::lmMiscSensorsDevice.48 = STRING: Core 10
LM-SENSORS-MIB::lmMiscSensorsValue.1 = Gauge32: 28000
LM-SENSORS-MIB::lmMiscSensorsValue.2 = Gauge32: 79000
LM-SENSORS-MIB::lmMiscSensorsValue.3 = Gauge32: 89000
...
LM-SENSORS-MIB::lmMiscSensorsValue.46 = Gauge32: 79000
LM-SENSORS-MIB::lmMiscSensorsValue.47 = Gauge32: 89000
LM-SENSORS-MIB::lmMiscSensorsValue.48 = Gauge32: 0
Once can see why more clearly what is going on with the following snmp tables:
matsya:~# snmptable -v 2c -c public jupiter LM-SENSORS-MIB::lmMiscSensorsTable
LM-SENSORS-MIB::lmMiscSensorsTable: No entries
matsya:~# snmptable -v 2c -c public jupiter LM-SENSORS-MIB::lmTempSensorsTable
SNMP table: LM-SENSORS-MIB::lmTempSensorsTable

 lmTempSensorsIndex lmTempSensorsDevice lmTempSensorsValue
                  1       Physical id 0              47000
                  2              Core 0              43000
                  3              Core 1              43000
                  4              Core 2              42000
                  5              Core 3              40000
                  6              Core 4              39000
                  7              Core 5              43000
OIDs:
matsya:~# snmptranslate -On LM-SENSORS-MIB::lmMiscSensorsTable
.1.3.6.1.4.1.2021.13.16.5
matsya:~# snmptranslate -On LM-SENSORS-MIB::lmTempSensorsTable
.1.3.6.1.4.1.2021.13.16.2
matsya:~# snmptranslate -On LM-SENSORS-MIB::lmMiscSensorsIndex
.1.3.6.1.4.1.2021.13.16.5.1.1
matsya:~# snmptranslate -On LM-SENSORS-MIB::lmTempSensorsIndex
.1.3.6.1.4.1.2021.13.16.2.1.1
A tree view of the LM-SENSORS MIB:
~# snmptranslate -Tp -IR lmSensors
+--lmSensors(16)
   |
   +--lmSensorsMIB(1)
   |
   +--lmTempSensorsTable(2)
   |  |
   |  +--lmTempSensorsEntry(1)
   |     |  Index: lmTempSensorsIndex
   |     |
   |     +-- -R-- Integer32 lmTempSensorsIndex(1)
   |     |        Range: 0..65535
   |     +-- -R-- String    lmTempSensorsDevice(2)
   |     |        Textual Convention: DisplayString
   |     |        Size: 0..255
   |     +-- -R-- Gauge     lmTempSensorsValue(3)
   |
   +--lmFanSensorsTable(3)
   |  |
   |  +--lmFanSensorsEntry(1)
   |     |  Index: lmFanSensorsIndex
   |     |
   |     +-- -R-- Integer32 lmFanSensorsIndex(1)
   |     |        Range: 0..65535
   |     +-- -R-- String    lmFanSensorsDevice(2)
   |     |        Textual Convention: DisplayString
   |     |        Size: 0..255
   |     +-- -R-- Gauge     lmFanSensorsValue(3)
   |
   +--lmVoltSensorsTable(4)
   |  |
   |  +--lmVoltSensorsEntry(1)
   |     |  Index: lmVoltSensorsIndex
   |     |
   |     +-- -R-- Integer32 lmVoltSensorsIndex(1)
   |     |        Range: 0..65535
   |     +-- -R-- String    lmVoltSensorsDevice(2)
   |     |        Textual Convention: DisplayString
   |     |        Size: 0..255
   |     +-- -R-- Gauge     lmVoltSensorsValue(3)
   |
   +--lmMiscSensorsTable(5)
      |
      +--lmMiscSensorsEntry(1)
         |  Index: lmMiscSensorsIndex
         |
         +-- -R-- Integer32 lmMiscSensorsIndex(1)
         |        Range: 0..65535
         +-- -R-- String    lmMiscSensorsDevice(2)
         |        Textual Convention: DisplayString
         |        Size: 0..255
         +-- -R-- Gauge     lmMiscSensorsValue(3)
- Enable SNMPD startup in
/etc/default/snmpd. - Bare-bones
/etc/snmp/snmpd.conf. - TCPwrapping the SNMPD daemon to give access only to the NMS (matsya) in
/etc/hosts.allow. - Make sure that the MIBS are loaded by commenting out
mibs :in/etc/snmp/snmp.confandMIBS=in/etc/default/snmpd. - Snmpd startup file
/etc/default/snmpd. Only snmpd, no trap daemon.
# This file controls the activity of snmpd and snmptrapd

# Don't load any MIBs by default.
# You might comment this lines once you have the MIBs downloaded.
#export MIBS=

# snmpd control (yes means start daemon).
SNMPDRUN=yes

# snmpd options (use syslog, close stdin/out/err).
SNMPDOPTS='-Lsd -Lf /dev/null -u snmp -g snmp -I -smux -p /var/run/snmpd.pid'

# snmptrapd control (yes means start daemon).  As of net-snmp version
# 5.0, master agentx support must be enabled in snmpd before snmptrapd
# can be run.  See snmpd.conf(5) for how to do this.
TRAPDRUN=no

# snmptrapd options (use syslog).
TRAPDOPTS='-Lsd -p /var/run/snmptrapd.pid'

# create symlink on Debian legacy location to official RFC path
SNMPDCOMPAT=yes
- SNMPD minimal config
/etc/snmp/snmpd.conf. Change the community string to some else than public please!
# Bare Net-SNMP snmpd configuration file. Brain Imaging Centre, 2014.
#
# This file was created with the command:
#       snmpconf -g basic_setup
# then was stripped of all comments describing the tokens.
#
# To recover them use the command:
#       snmpconf -R /etc/snmp/snmpd.conf -a -f snmpd.conf
#
# Warning: the file snmpd.conf will be overwritten without prompting the user
#          if it already exists in the current working directory.
#          See man snmpconf for further details.
#
sysLocation   "Brain Imaging Centre"
sysContact    root
sysServices    72
proc  mountd
proc  ntalkd    4
proc  sendmail 10 1
disk       /     10000
disk       /var  5%
load   12 10 5
master          agentx
agentAddress udp:161
rocommunity  public