1. Thompson C J, Murthy K, Weinberg I N, Mako F: "Feasibility Study for Positron Emission Mammography" Med. Phys. 21:4 529-537 (1994)
(This was the first paper published on this topic, and lead to the development of a successful instrument: PEM-1)
2. Thompson C J, Murthy K, Picard Y, Weinberg I N, Mako F M: "Positron Emission Mammography (PEM): A Promising Technique to Detect Breast Cancer" IEEE Trans. Nucl. Sci. NS-42 1012-1017 (1995)
3. Robar J L, Thompson C J, Murthy K, Clancy R, Bergman A M: "Construction and Calibration of Detectors for High Resolution Metabolic Breast Cancer Imaging" Nucl. Inst. and Meth. in Phys. Res. A 392 402-406 (1997)
4. Bergman A, Thompson C J, Murthy K, Robar J L, Clancy R, English M J, Loutfi A, Lisbona R, Gagnon J H: "Technique to Obtain Positron Emission Mammography Images in Registration with X-ray Mammograms" Med. Phys. 25: 2119-2129 (1998)
5. Murthy K, Jolly D, Aznar M, Thompson C J, Sciascia P, Loutfi A, Lisbona R, Gagnon J H: "Quantification in Positron Emission Mammography (PEM) with Planar Detectors: Contrast Resolution Measurements Using a Custom Breast Phantom and Novel Spherical Hot-Spots". IEEE Trans. Nucl. Sci. 46:6 2192-2196 (1999).
6. Murthy K, Bergman A M, Thompson C J, Robar J L, Lisbona R, Loutfi A, Gagnon J H: "Positron Emission Mammographic Instrument: Initial Results" Radiology 215:2 280-285 (2000)
7. Murthy K, Aznar M, Thompson C J, Lisbona R, Loutfi A, Gagnon J H: "Preliminary Clinical Evaluation of an Instrument for Positron Emission Mammography (PEM-I)" J. Nucl. Med. 41:12 pp 1851-1858 (2000).
(This paper won an award for the best clinical paper published in the Journal of Nuclear Medicine in the year 2000)
8. Karimian A, Thompson C J, Sarkar S, Raisali G, Pani R, Davilu H Sardari D: "CYBPET: A cylindrical PET system for breast imaging" Nucl. Inst. and Meth. (A) 545:2 427-435 (2005)
9. Thompson C J: "Instrumentation for Positron Emission Mammography" PET-Clinics in Breast Cancer 1:1 33-38 (2006) (invited paper)
Updated: January 16, 2006
|
|
|
|
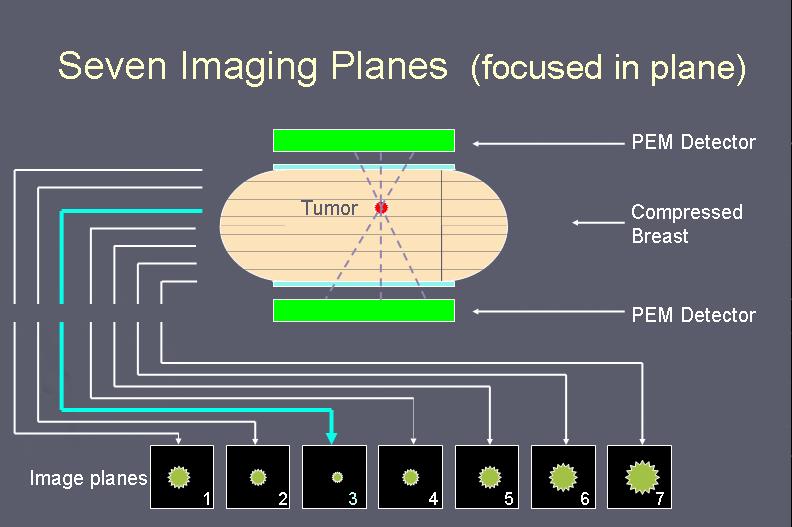
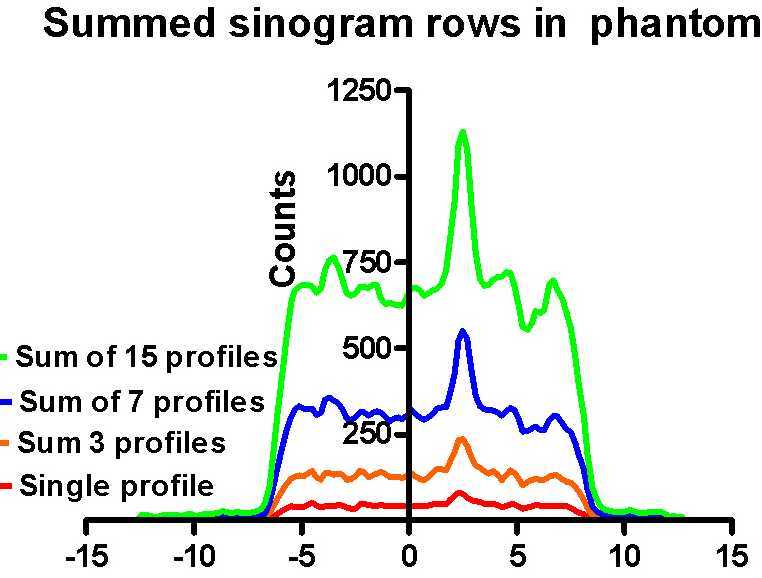
| Positron Emission Mammography was the term which we coined in our first publication in "Medical Physics" on this subject in 1994. The basic idea was to apply to improved specificity of FDG-PET imaging to breast cancer imaging in a way which correlated the metabolic images produced with conventional mammograms and did not require a full blown (and very expensive) PET scanner. Only two detectors would be used, one above, and another below the compressed breast. This could be done just after an X-ray image was acquired so the two images are perfectly co-registered to each other. | This concept was tested by comparing the signal to noise ratio a small subset of summed projections in the sinograms to profiles drawn through images in a compressed breast phantom scanned on a Scanditonix brain scanner (at right) the hot spot is clearly visible. By simply summing a subset of the projections as shown above, the "hot spot" (the peak in green profile) is as visible as in the reconstructed image. This is important, since the image formation required only back-projection which can be done easily during acquisition, producing a "live display" while the X-ray film was being developed. | This image is one section through the phantom as scanned with the Scanditronix scanner. In this study, many frames were acquired each with 1/2 the counts of the previous one. In all cases, the hot spot was as distinct in the summed projections (on the left) as the fully reconstructed image shown above. |
|
|
|
|
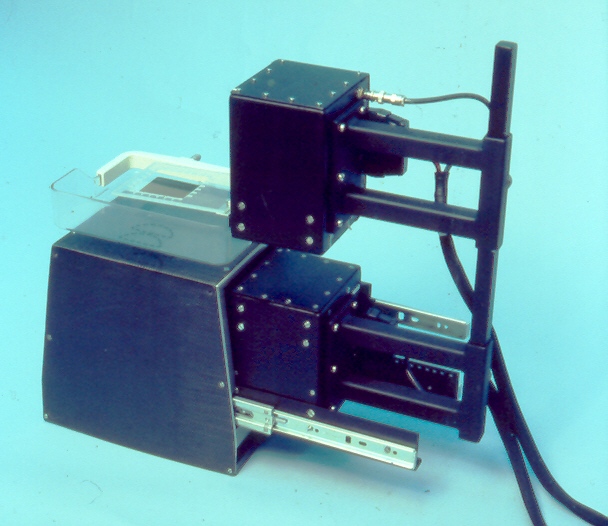
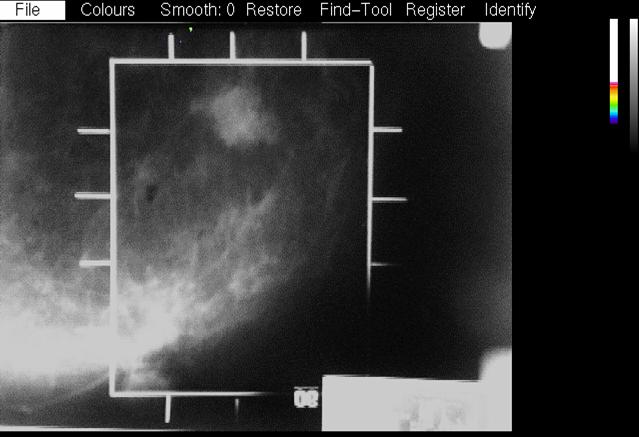
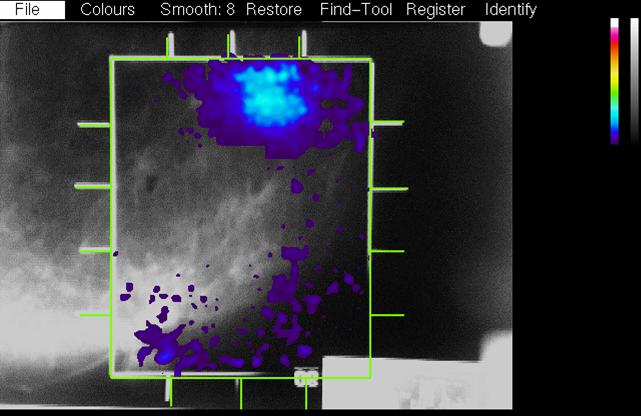
| This picture shows the PEM-1 detectors. The black shell at the lower left is the magnification table from the Philips mammography unit. We attached rails to this, (one is visible at the lower right) and attached the lower PEM detector box to them. The upper PEM detector could be raised and lowered on the bar at the right. A plastic piece with a wire frame attaches extended to the left of the top detector. The detectors are in the X-ray mammography position in this picture and the wire frame shows in the x-ray image and represents the PEM image field. | When an X-ray is taken with PEM detectors in this position, the wire frame is clearly visible on the image. This represents the "reference size" of the PEM field of view with a certain value of breast compression. If the compression thickness is greater, the frame is magnified more in the X-ray image. During the co-registration phase in the PEM analysis software, the frame is located by the user and the best focused PEM image is scaled to the X-ray image. | This image shows the PEM metabolic image scaled to the X-ray image and overlaid on it. Pixels above a user adjustable threshold show the PEM image in colour, and those below show the X-ray image in shades of grey. The X-ray images were digitized with a video camera mounted on a light box and acquired with a video frame grabber. |
|
|
||
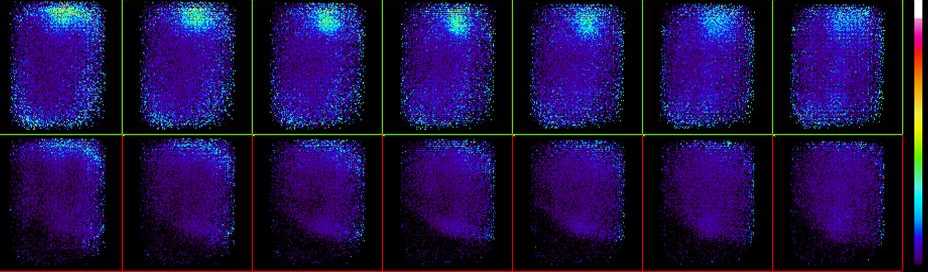
| The image above shows the seven images formed by back-projecting the acquired PEM data onto seven equally spaced planes whose separation was determined by the breast compression being used. The upper row show a region of high uptake near the top (which corresponds to near the chest wall). In this case it is best focused in image three placing it near the centre of the breast. The lower row shows the other breast which was always imaged and served as a reference which should be disease free. |
|
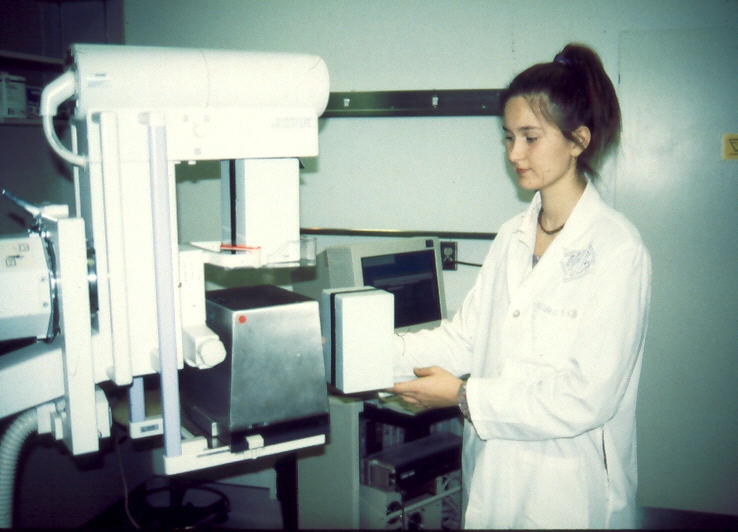
The image on the left was taken to indicate how the lower detector was to fit inside the "magnification table" which is an accessory sometimes used on this Philips mammography instrument. Alanah Bergman developed the techniques for co-registering the PEM and X-ray images, and acquired many of the PEM scans done using the PEM-1 instrument. |