Assumptions:
Let feature vector X be d-dimensional ( X=[x1,x2,...,xd]), and let its components be such that for each xi, i=1,...,d mean values follow the above assumptions.
Criterion of goodness of the individual discriminator xi is given through the probability of misclassification, that is:
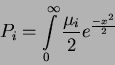 |
(28) |
Hence, with all given above we can actually rank our discriminators with respect to their individual power. Table 1. gives the overview of the relation between
![]() ,
for certain values.
,
for certain values.
| Pi % | 45 | 40 | 35 | 30 | 25 | 20 | 15 | 10 | 5 | 1 |
| .251 | .507 | .771 | 1.049 | 1.349 | 1.683 | 2.073 | 2.563 | 3.290 | 4.653 | |
| .063 | .257 | .549 | 1.110 | 1.820 | 2.833 | 4.296 | 6.569 | 10.82 | 21.65 |
Looking at the given table, having the high accuracy of classification as a target, we can deduce that variates with Pi of 40% or more would be considered as poor variates.