Next: Using subsets Up: Linear Models Previous: First linear model Contents Index
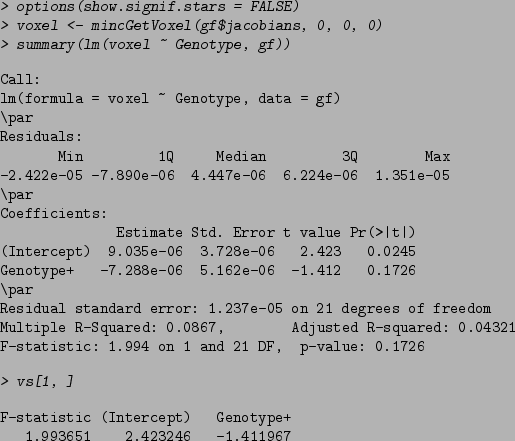
The code above does the following: it gets the voxel from coordinates 0,0,0 for all subjects, then computes a linear model relating that voxel to Genotype using standard R functions. Lastly it prints the results from that same voxel as computed by mincLm. This helps illustrate what the output of mincLm stores: the F-statistic is the same as can be found in the last line of the summary command, and the t-statistics for the Intercept and Genotype column can be found under "t-value" when using standard R functions.
mincGetVoxel needs three coordinates, given in voxel space in the same order as stored in the file. Just printing the voxel will show the corresponding world coordinates:
![\begin{Schunk}
\begin{Sinput}
> voxel
\end{Sinput}\begin{Soutput}[1]1.525891e-05...
...ordinates: 0 0 0
World Coordinates: -6.27 -8.19 -4.2
\end{Soutput}\end{Schunk}](img5.png)
If the coordinates are specified in world coordinates then mincGetWorldVoxel is what you want - it also takes three coordinates, this time in world space in xspace,yspace,zspace order:
