Next: Bits and Pieces Up: Linear Models Previous: Using subsets Contents Index
The example below illustrates the entire process involved in going running a linear model and correcting for multiple comparisons using the False Discovery Rate:
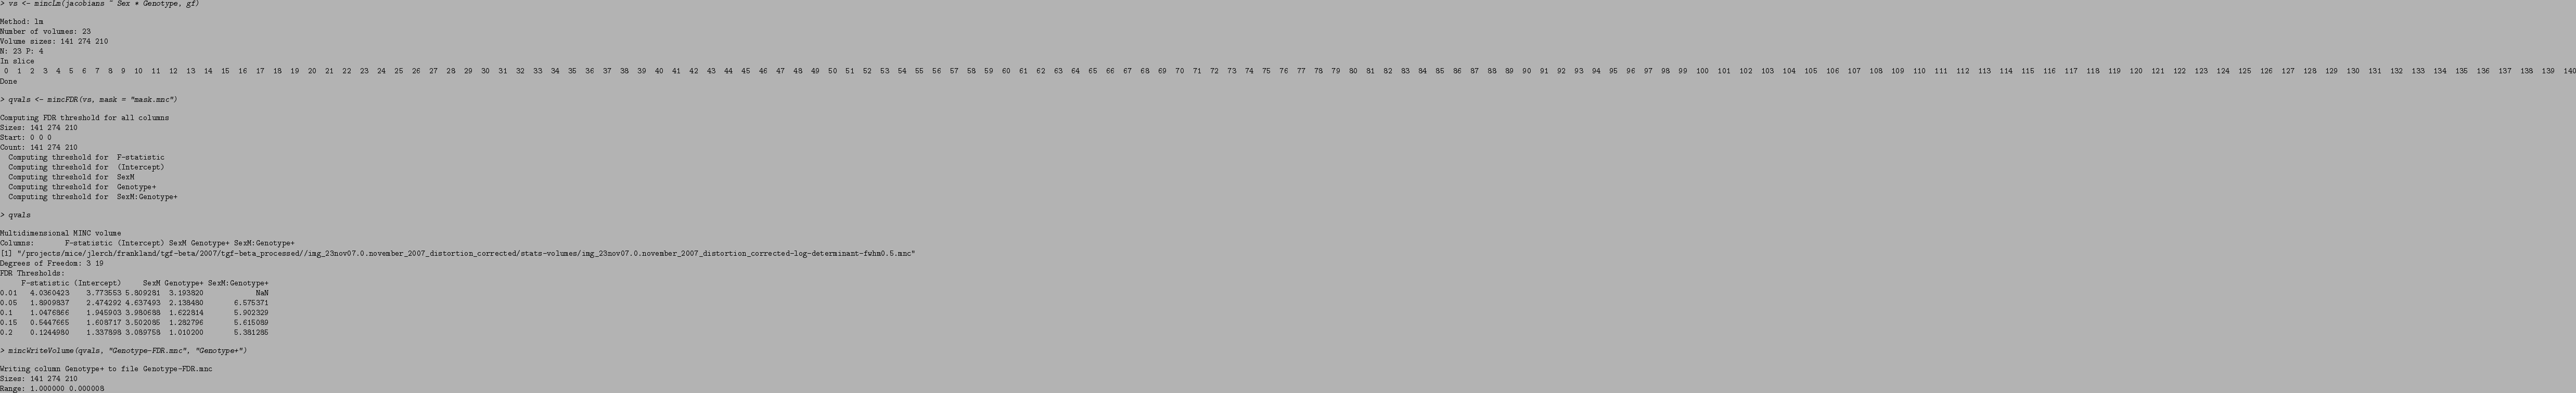
The first command computes an ANOCA using mincLm. The results are then passed on to mincFDR, which computes the False Discovery Rate threshold separately for each of the terms in the linear model. Only results from within the mask specified as an optional argument to mincFDR are considered. The thresholds detected at different levels (0.01, 0.05, 0.10, 0.15, and 0.20) are then printed out. The ``Genotype+'' column is then written to file.