FAQ Supplemental
Q1.8: Is there a fast way to check my fMRI images for random
artefact spikes like this?
A: Yes, there are several methods to quickly get an idea if something went
really wrong with any of your slices during your fMRI run. You may use, from
quickest to slowest, PCA Image, mincaverage, or xdisp.
This method involves a Principal Components Analysis (PCA) using fmristat's
pca_image. The command is available to you once you open a matlab window
from a BIC computer. You may type in 'help pca_image' at the matlab command
line for more information on how to use it. You should also refer to the following
webpage for a complete description including a worked out example and
figures: http://www.math.mcgill.ca/~keith/fmristat/#pca
For the purposes of finding spike artefacts that run across the entire field
of view of the image, you should not specify a mask threshold. The command could therefore be simply:
pca_image(input_file, [], 4)
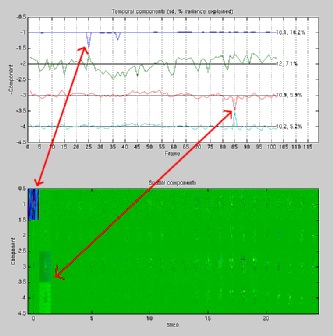
If there is a spike artefact in your image, you should be able to spot it as
a peak in one of the first components. While the plots in the top half of
the output window will show you the frame number during which the peaks
occurred, you can refer to the bottom of the figure to find out which
slice the artefact may correspond to.
Click on the image below to enlarge the sample PCA plot output figure. This is the output from an fMRI image
that has a spike artefact in slice #1 at frame 25 and another in slice #2 at
frame 85.
fMRI researchers at the BIC normally use mincaverage to obtain an average T1
weighted anatomical image of all of their subjects. However, mincaverage
can also be used to determine the standard deviation (sd) of the mean voxel
value in the functional images across time. If a spike artefact is present
in the fMRI time series, it would increase the sd value of the affected
voxels. You could run the command like this:
mincaverage -avgdim time -sdfile <sd_file> <input> <output_average>
Please note that the above command will create an average fMRI time series
image in addition to the sd image. You may delete this file after the
command has completed.
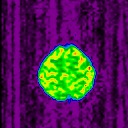
The sd output file will be a 3D minc image which you can view with xdisp,
or your minc viewer of choice. You could then step through each slice and
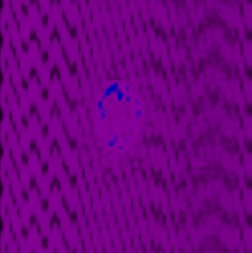
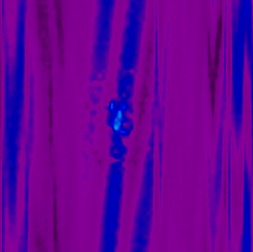
look for odd artefactual patterns saturating the image. Here are two sample
sd images of normal looking minc files which were free from spike artefacts:
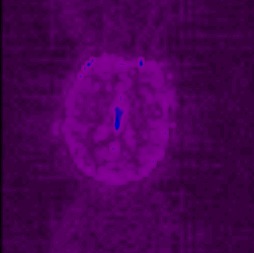
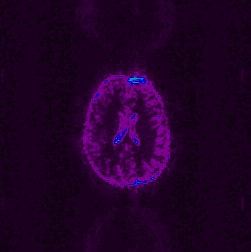
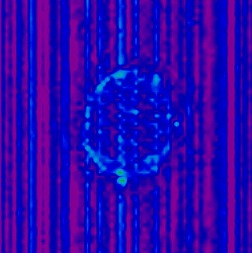
If there is a frame in your image set which does have an RF spike artefact,
it may manifest itself in the sd image. Here are some sample sd files from
fMRI image sets that experienced a spike artefact:
The 'plot' function of xdisp also works well to pick out strong transient
artefacts in fMRI images. Fire up xdisp from the command line,
then Right-Click-Once anywhere on the image to bring up the menu screen:
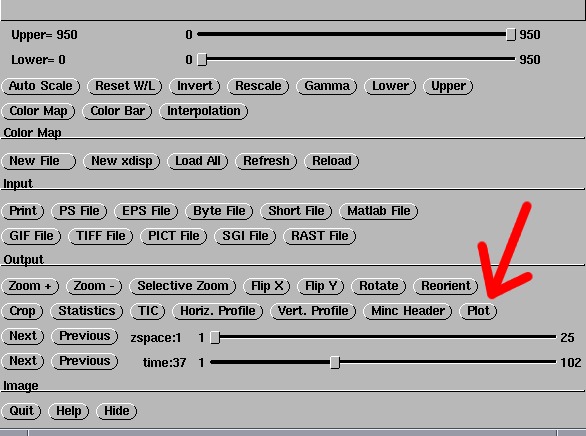
Click on the 'Plot' button that's pointed to in the above image. This
should open a window that looks like the following:
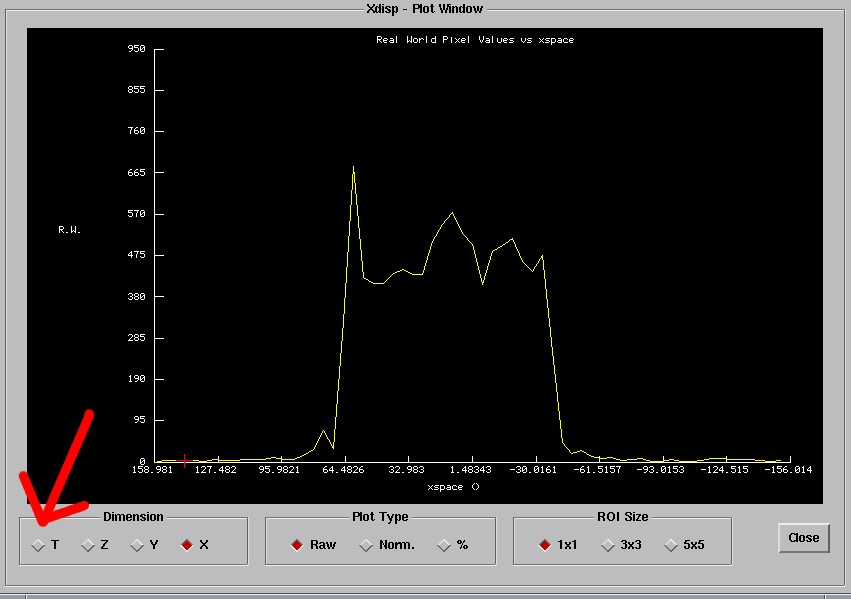
The default abscissa may be the x-coordinate. You will need to switch this
to the time dimension denoted by 'T'. Therefore, select the time dimension
that is pointed at by the red arrow in the above image.
Now, when you move your mouse cursor over voxels in the image, the plot
window will show you that voxel's intensity value across time. As you step
through the slices in the image, if there is a strong spike artefact, you
will see something like a sharp peak along the plot. The following figure
shows what this may look like.
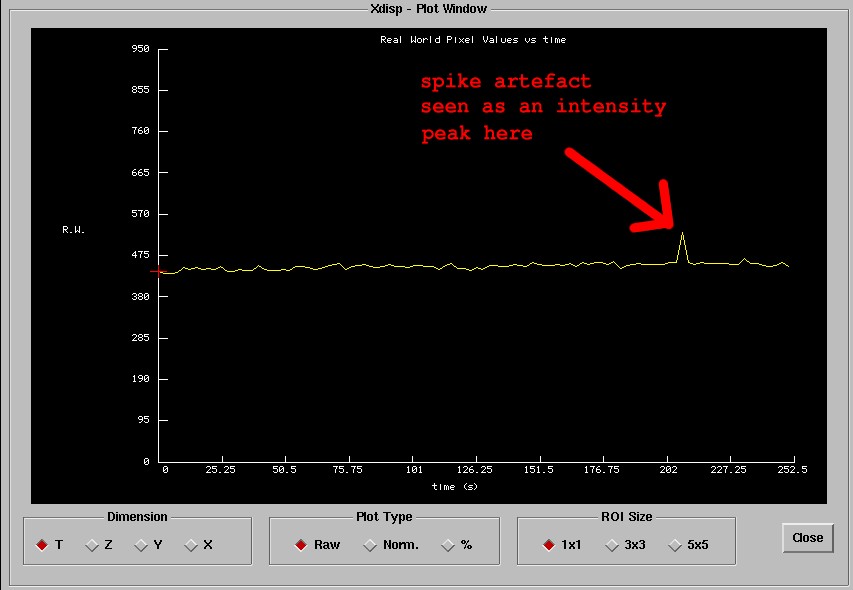
The time axis shows the in seconds the amount of time that has elapsed since
the start of the experiment. To find the approximate time value where you see
the spike, divide this by your TR, and add 1 to the result (to account for
the frame 1 offset). You should obtain an idea of the frame number when the
artefact occurred.
You would then be able to exclude the problematic frames from the analysis
by specifying the 'exclude' parameter of fmristat.
