PET Studies Demonstration
PET Studies Demo

Contents
1) Dopamine and Parkinsons Disease
2) Cortical Regions Activated by Pain and Vibration
3) Cortical Regions Activated by Auditory and Olfactory Stimulation
4) Uncoupling of Blood FLow and Oxidative Metabolism During Stimulation
of Somatosensory Visual Cortex
5) Functional Activation of the Human Frontal Cortex During the
Performance of Verbal Working Memory Tasks
6) Vibrotactile Stimulation
1) Dopamine and Parkinson's Disease
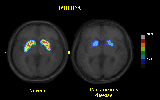
In Parkinson's disease there is a decreased level of dopamine in
certain areas of the brain. Figure 1 is a PET study showing the
differrence in F-DOPA levels between controls and Parkinson's
Disease.
 Click on image.
Figure 1: F-Dopa levels in a control and in a patient with
Parkinson's disease.
 Click on image.
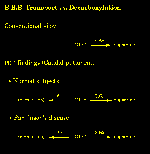
Figure 2: Metabolic Aberration of Dopamine in Parkinson's disease.
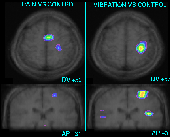
2) Cortical Regions Activated By Pain and Vibration
 Click on image.
Figure 3: Insert text here
 Click on image.
Figure 4: Insert text here
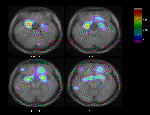
3) Cortical Regions Activated By Auditory and
Olfactory Stimulation
 Click on image.
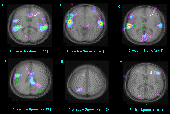
Figure 5: Insert text here
 Click on image.
Figure 6: Insert text here
4) Uncoupling of Blood Flow and Oxidative Metabolism During
Stimulation of Somatosensory Visual Cortex
The mechanisms that couple neuronal activity to blood flow and
oxidative metabolism are not yet known. An apparent uncoupling of
blood flow from oxygen metabolism during brief phasic stimulation of
somatosensory and visual cortex has been demonstrated by several
workers. The prediction was that selective visual stimuli may elevate
oxidative metabolism in regions of visual cortex with a high content
of cytochrome oxidase. To test this prediction, oxygen metabolism and
blood flow were measured in normal volunteers after different
durations of tonic stimulation. The stimulus was a semi annular
reversing contrast checkerboard pattern visible only to the left
visual field of the left eye between 5 and 20 degrees of visual angle
and at a retinal eccentricity of about 15 degrees (See Figure 7).
Oxygen consumption increased significantly in the primary visual
cortex after 3-5 minutes and after 8-10 minutes of stimulation (See
Figure 8). The result is consistent with a stimulus specific
modulation of oxidative metabolism in neurons with a higher than
average content of cytochrome oxidase. CBF = cerebral blood flow.
CMR = cerebral metabolic rate.
 Click on image.
Figure 7: The semiannular checkerboard stimulus presented to
the subjects.
 Click on image.
Figure 8: An example of the PET results showing increased
oxygen consumption.
5) Functional Activation of the Human Frontal Cortex During the
Performance of Verbal Working Memory Tasks
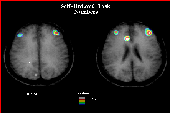
Regional cerebral blood flow was measured with PET during the
performance of verbal memory working tasks. In the first experiment,
subjects were asked to generate a sequence of 10 unordered numbers using
numbers 1 to 10 without repeating a number. For example,
"2,6,4,5,3,1,7,9,8,10" would be such a sequence. This is known as a
self-ordered task memory. In the second
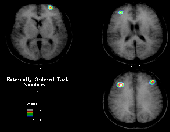
experiment, the subject was asked to monitor a sequence of 9 numbers
from 1 to 10 which were generated by the experimenter. One number was
intentionally omitted and the subject was asked to report which number
was omitted. This is known as externally ordered task memory. These
experiments require the subject to maintain all
the numbers that have already been used in working memory.
Examination of the difference in activation between these conditions
revealed strong bilateral activation within the mid-dorsolateral
frontal cortex during both experimental tasks. There was, however, no
evidence of additional activation within the mid-dorsolateral frontal
cortex when monitoring self-generated responses as compared with the
monitoring of externally generated responses (See Figures 9 and
10). These results provide evidence regarding the role of the
mid-dorsolateral frontal cortex in mnemonic processing that are in
agreement with recent findings from work with non-human primates.
 Click on image.
Figure 9: Activation of frontal cortex resulting from the
patient undergoind a self-ordered task.
 Click on image.
Figure 10: Activation of frontal cortex resulting from the
patient undergoind a self-ordered task.
6) Vibrotactile Stimulation
 Click on image.
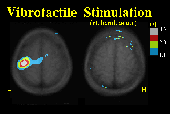
Figure 11: Insert text here
 Click on image.
Figure 12: Insert text here
 Click on image.
 Click on image.
  Click on image.
  Click on image.