 Click here for original publication.
2) Brief Description of Imaging Techniques
4) Stereoscopic 3-D Image Display
5) Functional Image Integration
6) Visualization of the Vasculature
7) Integration of Video
The original publication can be accessed as well. Click here for original publication.
 Click on image. (410K)
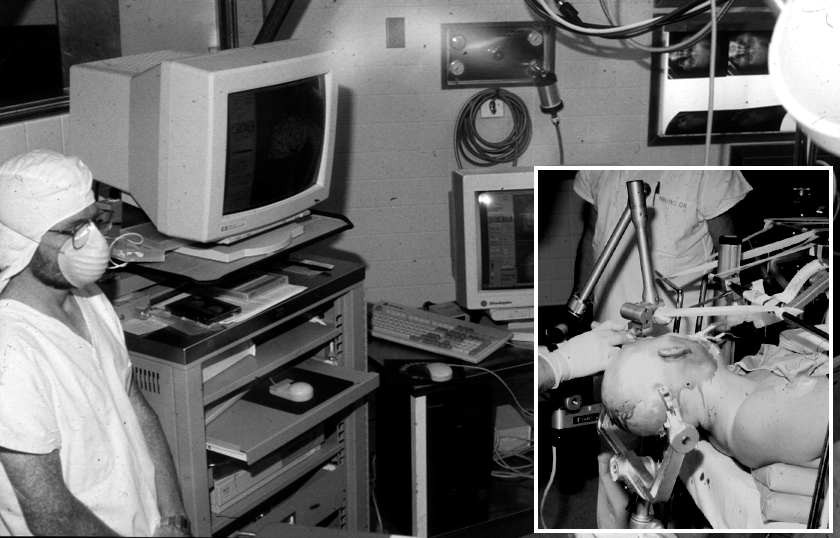
Figure 1: The ISG Viewing Wand in the operating room of the Montreal Neurological Institute. The position and orientation of the handheld probe (visible in the inset) is tracked by the computer and used to update the workstation display. The main Viewing Wand workstation is visible at the left of the image while a second computer on which enhancements to the Viewing Wand (PET and MRI data in this case) in positioned in the background.
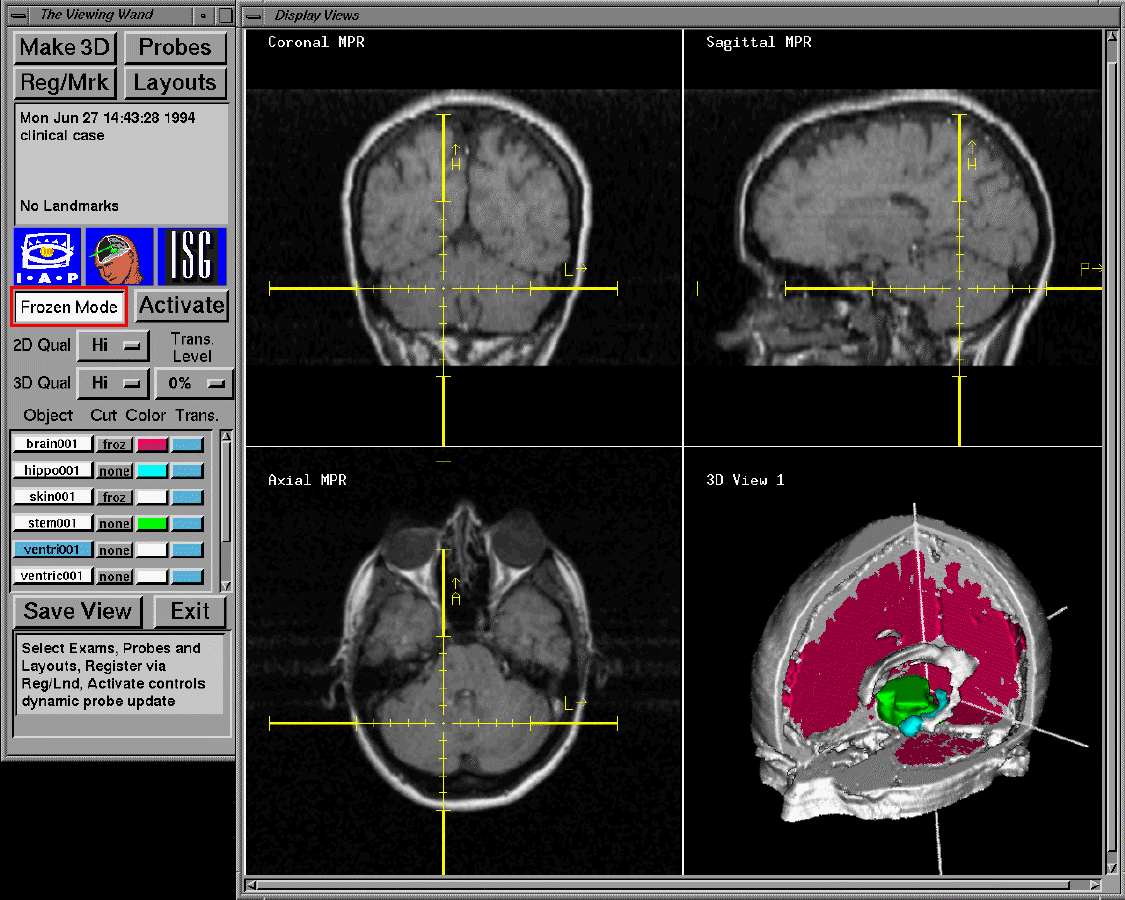
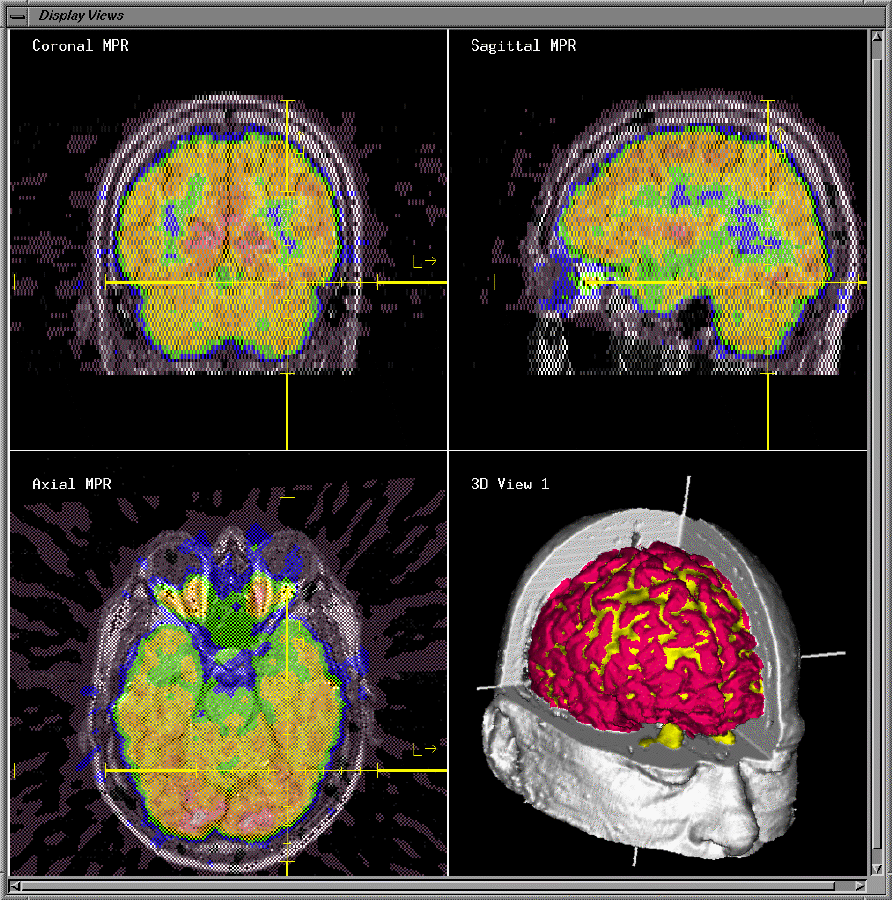
The ISG viewing wand if based on multiple slice MRI or CT data sets and presents the surgeon with 3-D images reconstructed from the slices. The surgeon uses a probe which is attached to the operating table via six mechanical joints. Transducers located in each of the six joints allow constant monitoring of probe position and allow the computer to display the probe position with respect to the displayed images. Hence the surgeon can "see" exactly where the probe is. A typical viewing wand screen is shown in Figure 2.
 Click on image. (256K)
Figure 2:The contents of a typical screen displayed by the ISG Viewing Wand during a surgical procedure. Note the display of reformatted 2-D MRI slice data and the display of 3-D objects (obtained by segmenting the slice data) in the lower right quadrant.
Recent extensions of the functionality of the viewing wand will be presently described and include:
Employing surface and volume rendered representations of a 3-D image on a 2-D screen allows the incorporation of visual cues such as shading and color in order to give an impression of depth. Often, these visual cues result in ambiguities which can be resolved with a true binocular, or stereoscopic representation. A stereo display system has been installed in the operating room of the Montreal Neurological Hospital. The system displays alternate images (left and right eye views) at a frame rate of 60 images per second per eye. Glasses worn by the surgeon incorporate active liquid crystal shutters that are synchronized to the display by means of an infrared beam so that each image is presented only to its appropriate eye.
Stereoscopic 3-D views are obtained in the following manner:
 Click on image. (80K)
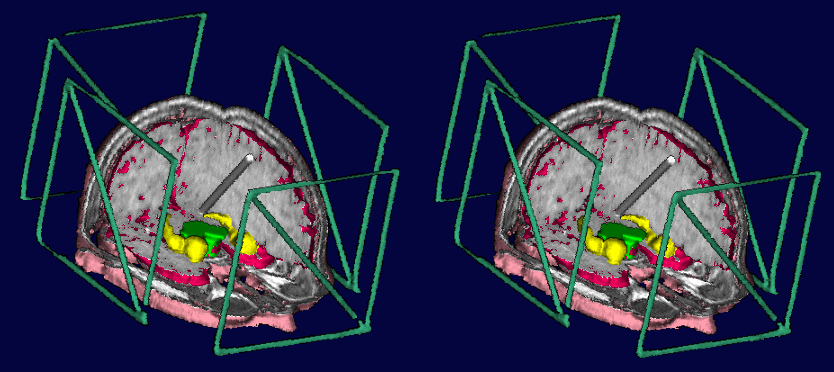
Figure 3: A stereo pair of Viewing Wand images of a patient undergoing a partial frontal lobectomy for the treatment of intractable epilepsy.
The procedure that combines the PET and MRI images uses a landmark matching algorithm that minimizes the mean squared distance between homologous points identified in each of the two volumes. This merging procedure results in an accuracy of +/-2-3mm. Figure 4 shows typical merged MRI and PET data, in this case for a patient undergoing surgery to remove cerebral tissue during the treatment of intractable epilepsy. The PET activity is indicated by the color scale superimposed on the underlying grey scale MRI image.
 Click on image. (294K)
Figure 4: Merged anatomical (MRI) and functional (PET) information as presented to the surgeon in the OR.
 Click on image. (117K)
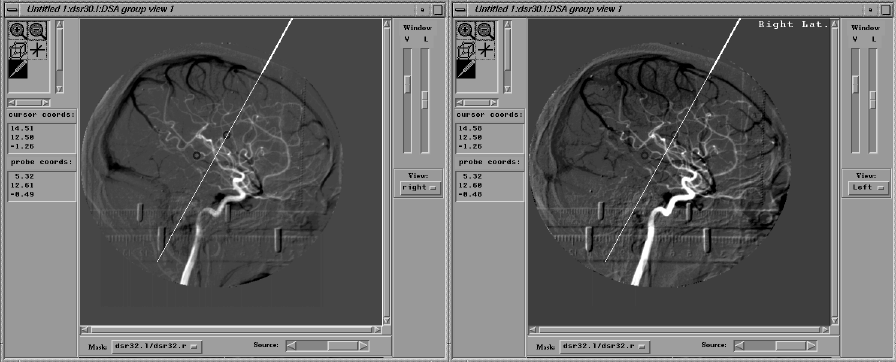
Figure 5: A stereo pair of DSA images of a patient undergoing a surgical procedure for the implantation of depth electrodes. The angiograms were obtained by angulating the gantry supporting the x-ray tube and image intensifier by 7 degrees between views. In each image, the venous frame has been subtracted from the arterial frame, giving a result which reflects both the phases.
6.2) MRA
Although DSA provides accurate localization of vascular structures, it
is not appropriate in all situation due to the unavoidable radiation
exposure and the need for the stereotactic head frame. MRA provides
details of the vasculature without these limitations, although at a
lower resolution and accuracy. Also, while DSA can be displayed only
in the plane in which it was recorded, MRA images can be viewed from
any arbitrary 3-D orientation. In addition, stereoscopic display of
MRA data removes all ambiguity of vessel and probe location.
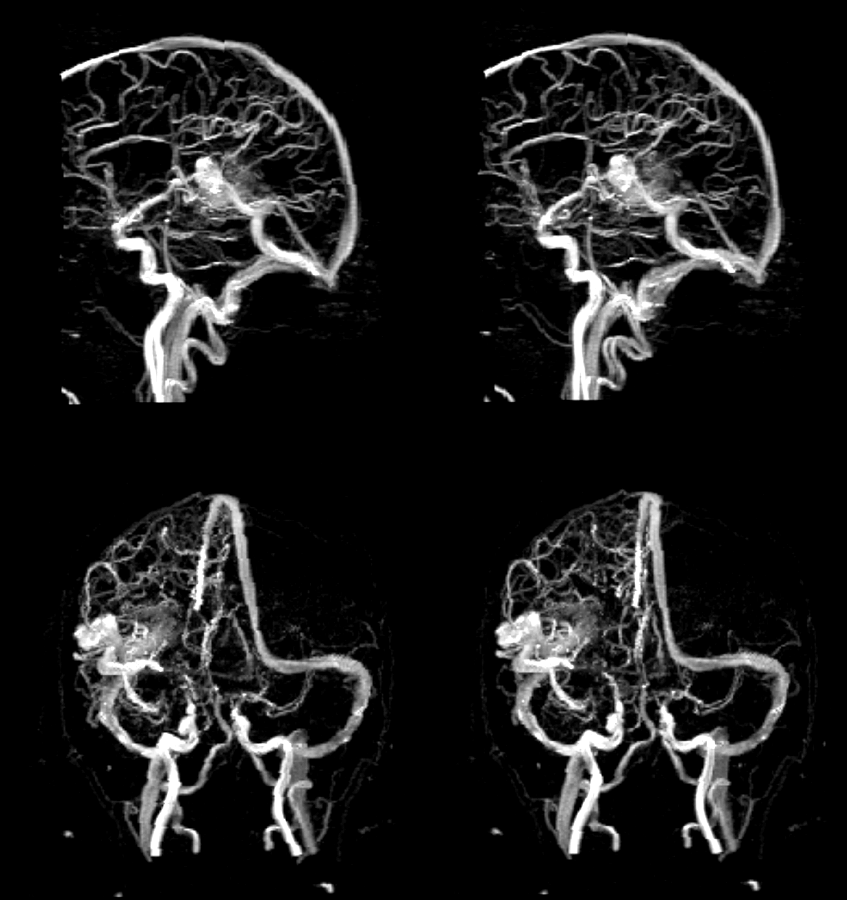
Two stereo pairs of MRA images exhibiting an arterio-venous malformation (AVM) are displayed in Figure 6, one from a lateral orientation and one from a frontal orientation. Also, a film depicting the MRA rotating through space is available by clicking below.
 Click on image. (286K)
Figure 6: Two stereo pairs of a phase contrast MRA data set of a patient exhibiting an AVM. The topmost pair of images is generated by selecting a lateral viewpoint to the left of the patient. In the bottom pair, the viewpoint is more frontal and superior. Note that because the acquired MRA data set is three dimensional, the choice of viewpoint is arbitrary
A major limitation of interactive image guided systems to date has been the lack of live feedback to indicate to the surgeon the actual state of the brain or position of the probe and other surgical instruments relative to the current position of brain structures during the procedures. Note that without live video integration, instruments other than the probe cannot be superimposed on the image guidance screen. Integration of live video with existing image guidance can overcome these shortcomings and provide feedback to the surgeon during the operation.
In the current implementation, a video image of the of the surgical scene is stored to computer memory. This image is displayed on the computer screen simultaneously with a mono representation of the surface of the cortex and related vasculature (from MRI or MRA data sets). This fused display provides the surgeon with feedback of significant morphological changes that haver occurred in the cortical surface during surgery. An example of the fusion of the live video and cortical surface as generated by segmenting an MRI signal is shown in Figure 7.
Click on image. (490K)
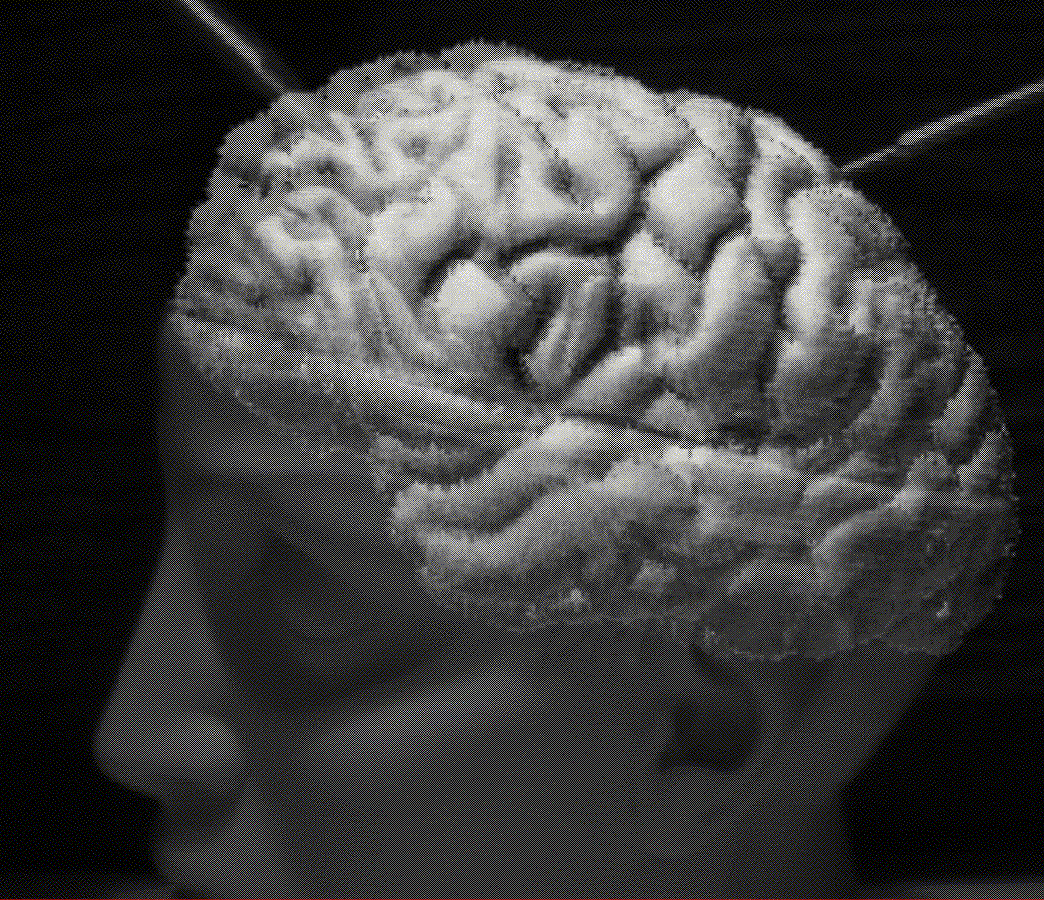
Figure 7: Fusion of video signal of the cortex of an excised brain with the surface rendering of the cortical surface obtained from an MRI scan of the brain. Note the two probes visible on the fused image which were present only in the video signal.
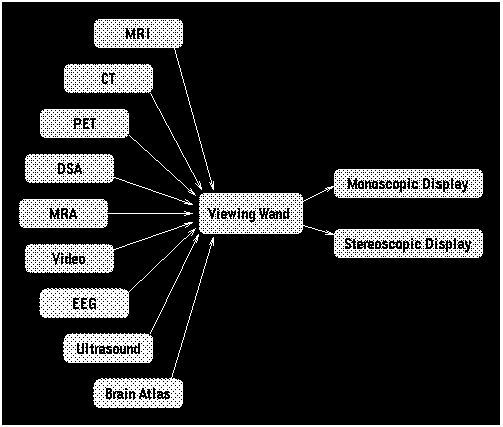
A major disadvantage at present is the limited real-time feedback to indicate to the surgeon the actual state of the brain or position of the probe relative to the current position of brain structures during the procedure. In the future, the solution of this problem will come from the further integration of various imaging modalities. An overview of the modalities that are currently employed or will be employed is shown in Figure 8.
 Click on image. (6K)
Figure 8: A conceptual diagram showing the modalities employed by the MNI viewing Wand system. MRI, CT, PET, DSA, MRA, and Video have already been employed while implementation of EEG, Ultrasound, and a Brain Atlas is underway.