minc3Dvis Man page
NAME
minc3Dvis - 3D visualization tool
SYNOPSIS
minc3Dvis <options>
DESCRIPTION
minc3Dvis is a 3D visualization tool which uses VTK (Visualization ToolKit). One of it's main purposes is to display fibertracking results from mincFibreTrack, but it's also very useful for looking at fibre propulations is each voxel, either vectors(single fiber) or ODFs (multi-fiber).
OPTIONS
	 -3DImage <3D_image.mnc>: 3D image on which to display objects such as tracts and ROIs
	 -tracts <tracts_1.vtk>...<tracts_N.vtk>: name of tract file as outputted by mincFibreTrack
	 -tubes: plot tracts as tubes
	 -map_tract_point_scalars: opacity at each point on tracts (needs to be speficied when writing the scalars field in the VTK file)
	 -colour_by_system: automatically colour each tract system with one different colour: default is to colour by direction
	 -scalars <scalars_filename.mnc>: colour tracts using this scalar minc file (takes precendent over other colouring instructions)
	 -scalar_range <low high>
	 -rois <roi_file_1.mnc> <low_threshold> <high_threshold> ... <roi_file_N.mnc> <low_threshold> <high_threshold> (threshold is inclusive)
	 -roicolour <red> <green> <blue>: all rois will be this colour instead of separate colours for each
	 -roiopacity <opacity_1> ... <opacity_n> (as many opacities as rois: must use -rois option first)
	 -vector <filename.mnc> [<filename2.mnc> <filename3.mnc>]: plot either e1 if three inputs (e1x, e1y, e1z) are given or maxima if one ODF file given
	 -vectormask <mask.mnc>: needs to be used with 'vector' option above
	 -vectorscale >scale.mnc>: scale vectors by values in this file
	 -greyvectors: plot vectors (and cones of uncertainty) in colour grey; default is colour coded by orientation
	 -noresample: assume all inputs are sampled in the same space (default is to resample them)
	 -sigma_theta <sigma_theta.txt>: input sigma_theta for each maximum.  This file must be paired with a -ODF_maxima input.  Plots cone subtending twice this angle (in degrees) around vectors (i.e., rotate angle sigma_theta around vectors)
	 -sigma_theta_const  <sigma_theta>: plots cone subtending twice this angle (in degrees) around vectors (i.e., rotate angle sigma_theta around vectors)

	 Options for High Angular Resolution Data (HARD)
	 -ODF <ODF_filename.mnc>: Orientation Distrubution Function in each voxel (length of segment in each direction)
	 -ODFmask <mask.mnc> (required if use the -ODF option)
	 -ODFdisplay: Stretch, Physical, SubtractMinimum (default is Physical)
	 -ODF_maxima <maxima_filename.mnc> (optional: input these if already calculated)
	 -ODF_opacity <opacity>
	 -ODF_colour <red> <green> <blue>: if nothing given, RGB scheme will be used
	 -ProbLabels <problabels.mnc>: input ProbLabel format file (for details, see ProbDeconvolve) and plot vectors and uncertainties based on the -label option (below)
	 -label <which_label>: <which_label> is one of "single","double","triple", "fan", or "mostlikely".
	 -movie <movie_name>: create .mpg movie_name.mpg (use mpeg_play to view)

	 there must be only one -tracts option and only one -rois option


   Generic options
	-help: Print summary of command-line options and abort.
KEY STROKE and MOUSE COMMANDS
left-mouse button-> rotate about the center of the image
right-mouse button outside image-> zoom in and out
right-mouse button inside image-> windowing level
middle-mouse button outside image-> move image within display window
middle-mouse button inside image
within blue frame-> orthogonal slice pan
outside blue frame-> rotation of axis about center
'r' key-> reset camera view KNOWN BUG: need to hit R to reset the view when you load the 1st time
'e' key-> exit application
hold shift + left-mouse button-> record a movie (use mpeg_play or mplayer to view it)
MOVIE OPTION
You might consider using
xvidcapon your Linux box instead of the-movieoption because for now it is not possible to pan slices with the minc3Dvis built-in version.
EXAMPLES
->Check that the eigenvectors are aligned the way you expect them to be (i.e. along tract direction):
minc3Dvis -3DImage dti-reg-to-t1-mask_FA.mnc -vector dti-reg-to-t1-mask_e1x.mnc dti-reg-to-t1-mask_e1y.mnc dti-reg-to-t1-mask_e1z.mnc -vectormask us_roi_CC-2planes.mncNOTE First select ROIs using Display (example regions shown above, it's best to try and get all 3 directions, so for example an roi ( 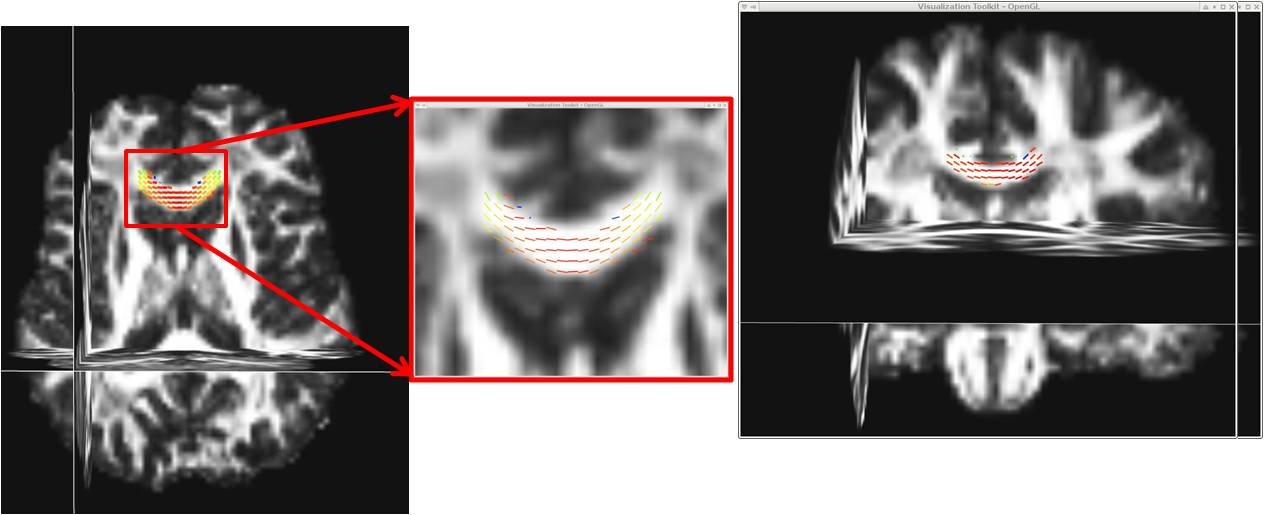
ROI.mnc) in both a coronal and a transverse slice)
-> Display the connectivity map generated by mincFibreTrack on the anatomical image along with the roi (us_cc.mnc)(1s inside the corpus callosum and 0s everywhere else) that was used for the tracking:
minc3Dvis -3DImage anat-n3.mnc -rois conn-cc.mnc 0.5 1.5 us_cc.mnc 0.5 1.5 -roiopacity 0.5 1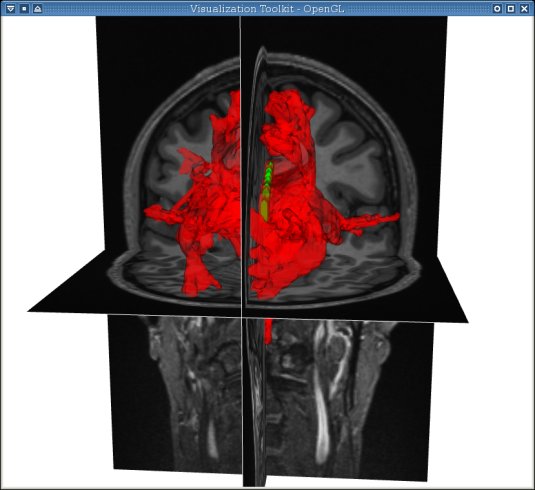
NOTE: The thresholds given for the ROI are "0.5 1.5" because all values within it should be 1. The tresholding is useful when you have multiple ROIs with different label numbers within the same file. The color of the ROIs is assigned in order; red, green, cyan, etc. Therefore, in this example, the red is the connectivity map and the green is the seed region. Here we choose a different opacity for each such that we can visualize the seed region through the map.
->Display the output tracts generated by mincFibreTrack on the anatomical map along with the roi (
us_cc.mnc) that was used for the tracking (display in white). By default, the tracts are colored by direction:
minc3Dvis -3DImage anat-n3.mnc -tracts tracts-output.vtk -rois us_cc.mnc 0.5 1.5 -roicolour 1 1 1 -roiopacity 1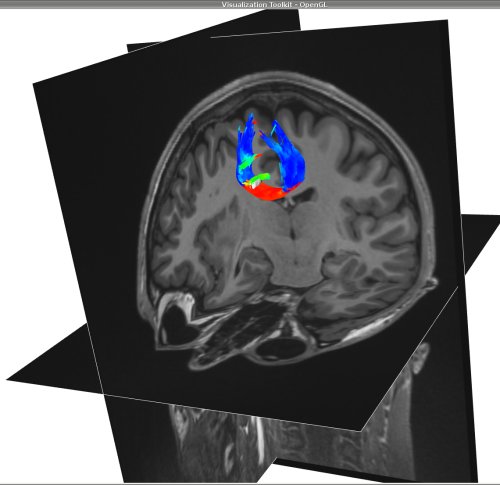
->Display the output tracts generated by mincFibreTrack, specifying a different color for each roi and each tract:
NOTE: Refrain from displaying tracts, especially with theminc3Dvis -tracts tracts-output.vtk tracts-output2.vtk -tractcolour 0.5 0 0 0.3 0.1 0.5 -rois us_roi.mnc 0.5 1.5 us_roi2.mnc \ 0.5 1.5 -roicolour 0 0.5 0.5 1 0 0 -roiopacity 1 1(if you don't specify tract colours, you can use-colour_by_system, and each tract file will show up in a different default colour)
(if you don't specify roi colours, each roi file will show up in a different default colour)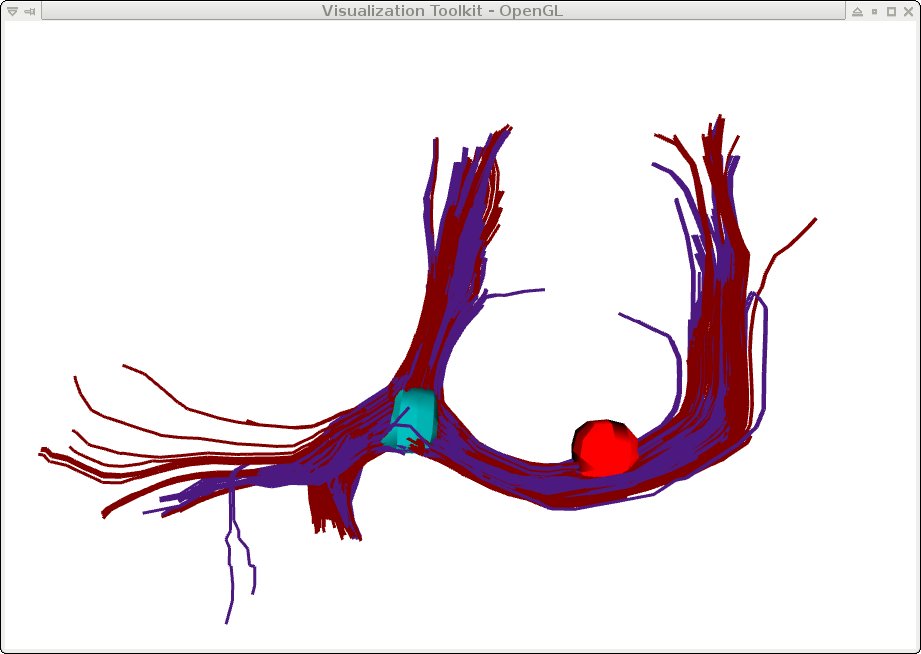
-tubes option, when the tracts are very large, this significantly slows down the visualization. Try using the ROI option above. Also note that the color of the ROI is chosen to be white, because it would be difficult to see in red.
-> Looking at the Orientation Distribution Function (ODF) in every voxel (as output by mincDeconvolve ):
minc3Dvis -ODF deconvolve.mnc -ODFmask us_roi_view_ODF-small.mnc -vector deconvolve.mnc -vectormask us_roi_view_ODF-small.mncNOTE: The 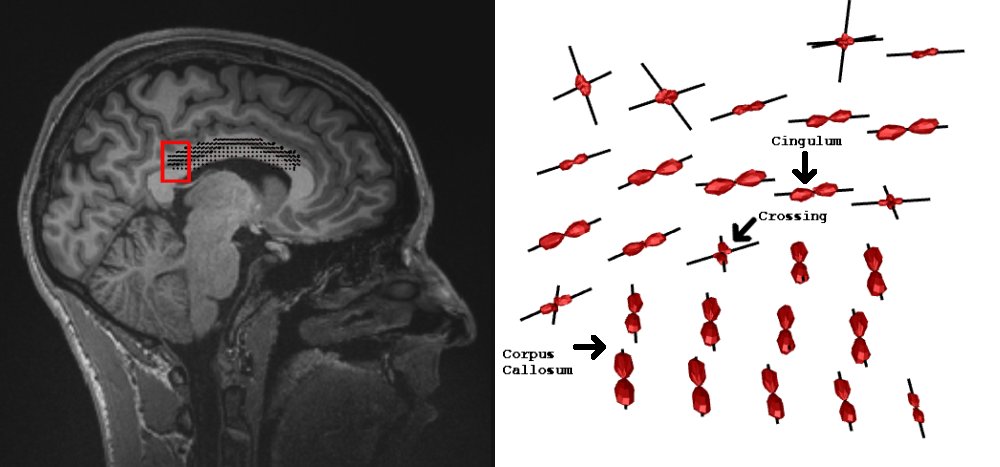
-ODFoption displays the ODFs and the-vectoroption displays the vectors along the maxima (i.e. the fibre orientations)
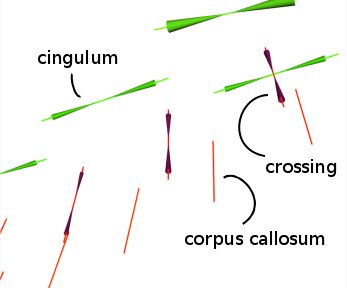
-> Looking at the Orientation Distribution Function (ODF) in every voxel and the uncertainty associated with each direction (as output by mincProbDeconvolve ):
minc3Dvis -ProbLabels prodeconv.mnc -vectormask roi.mnc -noresample
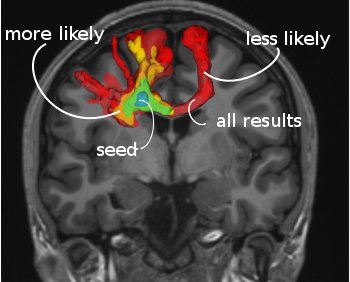
-> Looking at probabilistic tractography result (as output by the probabilistic algorithm from mincFibreTrack), the value in each voxel expresses the confidence in it being connected to the seed roi. You can display different level sets to see which regions have a higher connectivity:
minc3Dvis -rois conn_index.mnc 0.0001 1000 conn_index.mnc 4 1000 conn_index.mnc 40 1000 roi.mnc 0.5 1.5
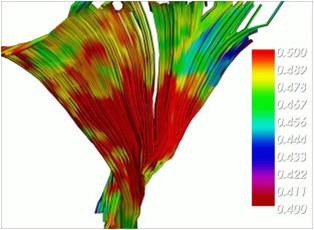
-> Overlapping a scalar map and the results from tractography (in this case magnetization ransfer (MT)):
minc3Dvis -tracts tracts_deconv.vtk -scalars MT.mnc scalar_range 0.4 0.5
Ilana LEPPERT
created: 21st March 2007
last modified: Nov 8th 2013