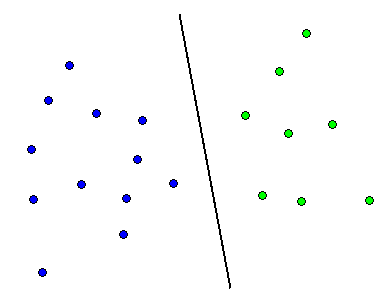
How:


How is this editing done? But first, what are "proximity graphs"?

Proximity graphs

Proximity graphs attempt to represent the overall spatial arrangement of the points in a set. In such a graph, two points are connected by an edge if they are, by a certain measure, "close together". Specifically, this measure can be: two points are close together if there are no other points in a certain "forbidden region" defined by these two points.

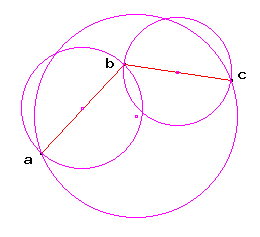
One such proximity graph is the Gabriel graph: given a set of points in the plane, two points are connected by an edge ab if there are no other points inside the circle having ab as a diameter. For example:

Gabriel graph and diametral circles for points a, b, c

Points a and c are not connected because point b is inside their diametral circle, but points a and b are connected because their circle is empty.

The Gabriel graph (as well as the Relative Neighborhood graph) are in fact particular cases of a continuous family of proximity graphs called Beta-skeletons. In these graphs, the "forbidden region" around two points is defined according to a positive parameter Beta.

An intuitive explanation of Beta-skeletons is through an analogy with patterns of roads [6]: a road connecting two cities will most likely follow the shortest path (straight line) unless there is a third city only a "small detour" somewhere along the way.

Editing training sets

One method for removing incorrectly labelled samples from the training set ([11]) is described below:

The basic idea is to try to identify the "rogue" samples by examining their neighborhood. Under the assumption that most of the samples in the set are correctly labeled, an incorrectly labeled sample will likely have most of its neighbors from a different class.

What is the neighborhood of a sample? It is defined by the proximity graph of the entire set: two samples are (graph) neighbors if they are directly connected by an edge in the graph.

Here is the editing method :

  • step 1: build the proximity graph of the entire set.
  • step 2: for each sample in the set:
    1. find all its graph neighbors.
    2. take a vote among these neighbors; determine the most represented class (the "winning" class).
    3. mark the sample if this winning class is different than the label of the sample.
  • step 3: delete all marked samples from the set.

Note that the order in which the set is processed does not matter: the method deletes samples in parallel (all at the same time, in step 3).

Here is an example:
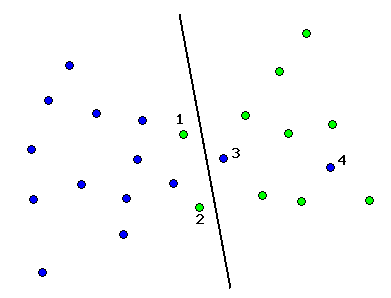
training set for a 2-class problem, and the linear decision boundary

There are two classes of points in the plane (blue and green), and a line determined by some classifier that attempts to separate the classes. Note that there is some overlap between the two classes: points 1, 2, and 3 are near the line ("decision boundary") but on the wrong side of it. Moreover, possibly due to a measurement error, point 4 is far into "green's territory".

Now, let's apply the above method: first, build a proximity graph (Gabriel graph in this example) for the set.
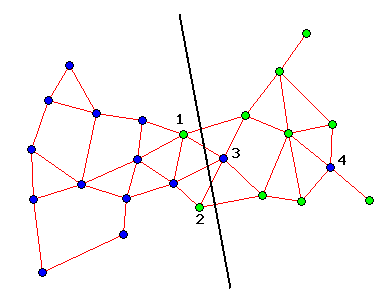
the Gabriel graph of the above training set

Points 1-4 will be marked, and subsequently deleted by the method. For example, in the figure above: green point 1 is connected by edges to four blue neighbors and to one green neighbor; blue point 4 has only green neighbors, and so on.
edited training set, and the linear decision boundary

After eliminating the "rogue" samples, the two classes of points are correctly separated by the line.

Note: in general, the above editing method may not clean all the "rogue" samples from the training set. However, the method can be applied again on the new training set.


Table of Content WHAT and WHY HOW SHOW ME FURTHER INFO

Chris Cocosco <crisco@bic.mni.mcgill.ca>

$Date: 2002/01/23 16:10:33 $ GMT