 |
 |
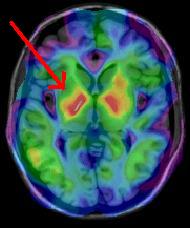 |
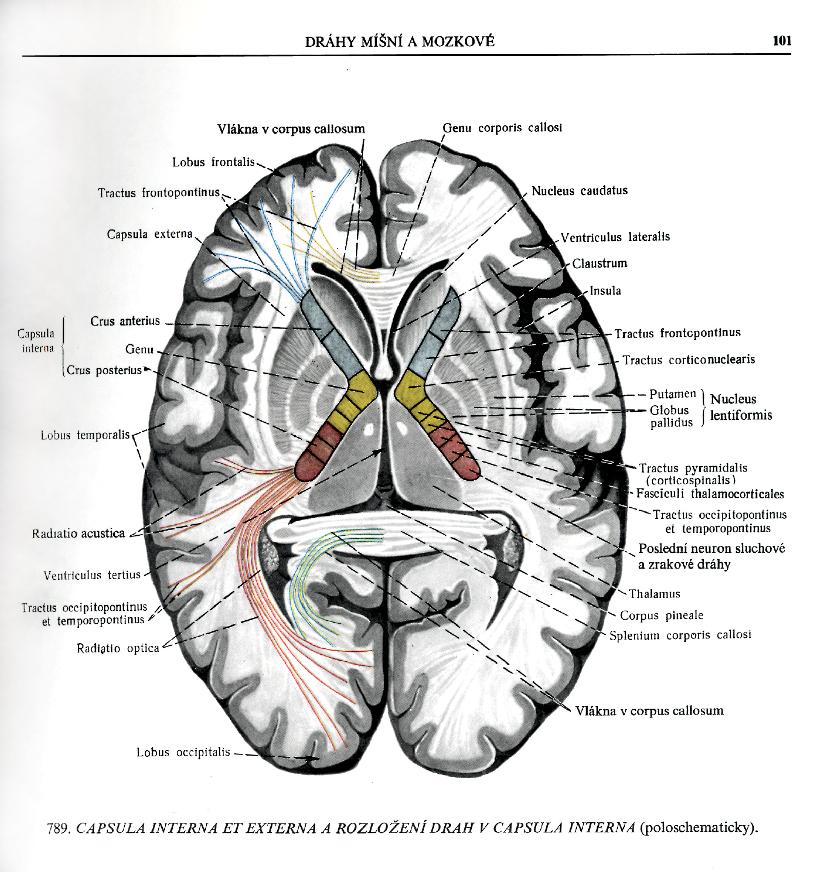
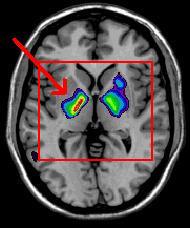
| Click on this image to see a description of the relevant neuroanatomy. The red box represents the area enlarged below. | Thresholded, z=0 (the movie runs from z=75 to z=-12). The red box represents the area enlarged below. | Not thresholded, z=0 (the movie runs from z=75 to z=-12) |
 |
 |
|
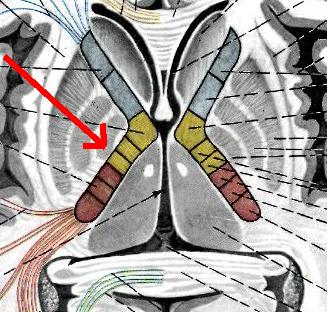
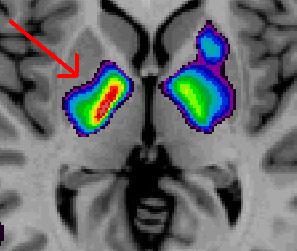
| A zoomed in version of the atlas | Thresholded, zoomed, z=0 (the movie runs from z=20 to z=-12) |