THESIS TITLE
Spatial Statistics and Their Application to Neuroimaging Study of Multiple Sclerosis Patients
Liqun Fu
Department of Epidemiology and Biostatistics
McGill University
May 6, 1997
A thesis submitted to
the Faculty of Graduate Studies and Research
in partial fulfillment of the requirement of the degree of
Doctor of Philosophy
©Liqun Fu 1996
Proton Magnetic Resonance Spectroscopy (MRS) is an effective technique for imaging axonal damage in the brains of multiple sclerosis (MS) patients. This is based on decreases in signals from N-acetyl groups, which come primarily from the neuronal marker, N-acetylaspartate (NAA). Magnetic Resonance Spectroscopic Imaging (MRSI) visualizes the spatial distribution of the NAA intensities in the brains of MS patients. It can be combined with conventional Magnetic Resonance Imaging (MRI) and other clinical information in order to better understand of the disease pathology.
This thesis comprises three independent but interconnected manuscripts concerning the
application of MRSI and MRI to clinical research in MS.
(1) In the first, a statistical method for multimodal analysis
of MR spectroscopic images is developed. This method, an extension of
random effects models, allows for quantification of differences
in images from different subgroups of patients
with MS and determination of the dependence
of chemical pathology on clinical disability, duration of disease,
and lesions on T2-weighted MRI.
Statistical power is enchanced by using all reliable
resonance intensities in the spectroscopic images
while taking into consideration the intra-subject correlations
and signal overlap in images.
An illustrative example of these spatial statistics is also presented.
(2) The spatial statistics have been extended in paper two to spatial-temporal cases
in order to analyze imaging data collected from longitudinal studies.
An added advantage of this method is its ability to handle missing data
common in longitudinal studies.
The method was applied to serially collected MRSI data from 28 patients with MS
(11 relapsing remitting (RR) and 17 secondary progressive (SP) ) and 12 normal controls.
Results shows that the NAA intensity was
lower in the normal appearing white matter (NAWM) of patients compared to normal controls and the NAA intensity
was ![]() lower ( p < 0.01 ) in the NAWM of SP than of RR patients.
The NAA was also lower in lesion volumes than in the surrounding
NAWM (
lower ( p < 0.01 ) in the NAWM of SP than of RR patients.
The NAA was also lower in lesion volumes than in the surrounding
NAWM ( ![]() in RR and
in RR and ![]() in SP).
Nevertheless, it was the decrease
in the NAA intensity in the NAWM that accounted for most of the observed
in SP).
Nevertheless, it was the decrease
in the NAA intensity in the NAWM that accounted for most of the observed ![]() (p < 0.001)
decrease in NAA intensity in the brains of RR patients over the study period.
The decrease in NAA in NAWM correlated strongly (p < 0.001)
with changes in disability in the RR subgroup.
These results highlight an association between axonal damage or loss
and increasing disability in MS and suggest that accumulation of
secondary axonal damage in the NAWM may be an important mechanism
of functional impairment with this disease.
(3) Finaly, a computer package integrating the spatial statistics and other
image processing methods was developed.
The primary purpose of this package is to promote the use of spatial statistics
by researchers in the field of neuroimaging.
Different study designs can be incorporated.
The software also serves as a tool for organization, visualization, and manipulation of imaging data
with the help of friendly graphical user interface.
To allow new imaging analysis methods to be integrated efficiently,
an open design has been chosen which users can adapt to implement
their own research ideas.
This software works on workstations (SGI, Sun, etc.) and personal computers
(IBM Pentium and Macintosh Power PC) running the UNIX operating system.
(p < 0.001)
decrease in NAA intensity in the brains of RR patients over the study period.
The decrease in NAA in NAWM correlated strongly (p < 0.001)
with changes in disability in the RR subgroup.
These results highlight an association between axonal damage or loss
and increasing disability in MS and suggest that accumulation of
secondary axonal damage in the NAWM may be an important mechanism
of functional impairment with this disease.
(3) Finaly, a computer package integrating the spatial statistics and other
image processing methods was developed.
The primary purpose of this package is to promote the use of spatial statistics
by researchers in the field of neuroimaging.
Different study designs can be incorporated.
The software also serves as a tool for organization, visualization, and manipulation of imaging data
with the help of friendly graphical user interface.
To allow new imaging analysis methods to be integrated efficiently,
an open design has been chosen which users can adapt to implement
their own research ideas.
This software works on workstations (SGI, Sun, etc.) and personal computers
(IBM Pentium and Macintosh Power PC) running the UNIX operating system.
According to the specifications of manuscript-based thesis, the five indented paragraphs below should be reproduced in full in the preface of this thesis.
=18pt =0pt Candidates have the option of including, as part of the thesis, the text of a paper(s) submitted or to be submitted for publication, or the clear-duplicated text of a published paper(s). These texts must be bound as an integral part of the thesis.
If this option is chosen, connecting texts that provide logical bridges between the different papers are mandatory. The thesis must be written in such a way that it is more than a mere collection of manuscripts; in other words, results of a series of papers must be integrated.
The thesis must still conform to all other requirements of the "Guidelines for Thesis Preparation". The thesis must include: A Table of Contents, an abstract in English and French, an introduction which clearly states the rationale and objectives of the study, a comprehensive review of the literature, a final conclusion and summary, and a through bibliography or reference list.
Additional material must be provided where appropriate (e.g. in appendices) and in sufficient detail to allow a clear and precise judgment to be made of the importance and originality of the research reported in the thesis.
In the case of manuscripts co-authored by candidate and others, the candidate is required to make an explicit statement in the thesis as to who contributed to such work and to what extent. Supervisors must attest to the accuracy of such statements at the doctoral oral defense. Since the task of the examiners is made more difficult in these cases, it is in the candidate's interest to make perfectly clear the responsibilities of all the authors of the co-authored paper. Under no circumstances can a co-author of any component of such a thesis serve as an examiner for that thesis.
Multiple sclerosis (MS) is one of the most common neurological disorders that affects young adults most of which are of Northern European ancestry. The pathology of MS is complex and still not definitely understood. Early pathological studies suggested that demyelination and inflammation co-exist in MS with relative preservation of axons. Inflammation is temporal and totally recoverable. Demyelination causes conduction block of axons but partial remyelination and, probably more importantly, the increase in sodium channels at the demyelinated part of axons may partially resolve the axon conduction. Neither inflammation nor demyelination can satisfactorily explain the irrecoverable neurological deficit in MS.
Recent experimental studies have confirmed significant axonal involvement in the pathology of MS, and it has been suggested that axon loss may hinder the conduction recovery at the demyelinated axons supporting the hypothesis that axonal degeneration leads to the irreversible neurological deficit in MS.
Magnetic resonance (MR) allows in vivo investigation of the underlying pathology of MS. In vivo assessment of axon pathology has become possible by several MR technologies. Among them, the long echo-time proton magnetic resonance spectroscopy (MRS) is the most promising as it provides N-acetylaspartate (NAA) resonance intensity, a readily quantifiable index of axonal dysfunction or volume loss. Magnetic resonance spectroscopic imaging (MRSI) provides maps of the regional distribution of metabolic changes associated with axonal loss. It offers a promising way to monitor the axon changes in order to better understand the MS pathology.
In clinical trials of treatment for MS, it is difficult to assess treatment success due to the lack of a sensitive outcome measure. There is increasing enthusiasm for using magnetic resonance imaging (MRI) as an outcome to supplement clinical outcome measures. However, MRI shows pathologically-defined "plaques" which are not specific to either MS pathologies or clinical disabilities. It is hoped that MRSI can offer a supplementary index to monitor MS progression as well as to assess the treatment effect of MS.
A detailed description of MS and MR technologies is given in Chapter 1. A review of studies in the field can be found in Chapter 2 followed by a description of the methodology of the thesis research. The primary object of this thesis is to investigate the axon pathology of MS based on MR spectroscopic images, MR images, and clinical information on a group of MS patients. In the first manuscript (Chapter 3), a statistical method which is an extension of mixed effect model for longitudinal data to spatial cases is presented with an application to MS. This method overcomes the analytic difficulties encountered in many studies using image data.
The second manuscript (Chapter 4) describes a 3-year longitudinal study of 28 MS patients which implemented the above statistical methodology. MRSI, MRI, and clinical information were collected during the study. The distinct features of this study include its size, length of follow-up, and statistical analysis. Results of this study and its contributions to our current knowledge of MS are also discussed.
A major challenge encountered in longitudinal neuroimaging studies is the quantity and the complexity of the information collected during the study. To facilitate the implementation of the methodology developed in the project, a computer package has been written. This computer package also serves as a tool to organize large and complicate medical imaging data sets. It is presented in manuscript 3 (chapter 5).
This thesis contains no material which has been accepted for the award of any degree or diploma in any university. Also to the best of my knowledge and belief, this thesis contains no material previously published or written by another person, except where references are made in the context of this thesis. Additionally, the data included in the thesis were originally collected for the specific purpose of this thesis.
Manuscript one has, for the first time, presented a systematic statistical analysis method for multimodal neuroimaging data. Findings of manuscript two, especially the MS pathology in normal appearing white matter, are original in the field. There exists no computer software, to the best of my knowledge, that offers to the user, the features available in the software described in manuscript three.
I have done, under the supervision of thesis co-supervisors and the thesis committee, most of the work on my own at the phases of design, conduct, and composition of this thesis. However, the physiological findings of this thesis are based on a longitudinal study conducted by the Magnetic Resonance Spectroscopy (MRS) group at the Montreal Neurological Institute who are co-authors on all three manuscripts.
It was in early 1992 that, after four years of work as an engineer, I got an idea to switch into the medical field. A letter from Dr. Christina Wolfson, in which she agreed to supervise me during my PhD study, gave me a chance to achieve what I had in mind. Challenges for becoming an epidemiologist are always under-estimated, and I am not an exception. I cannot forget how helpless I was the first time I tried to read an epidemiological article. Thinking how much thought I can give to an epidemiology article now, I own much of this difference to the time Dr. Wolfson spent with me reviewing all kinds of research literatures. I am also greatly indebted to Dr. Wolfson for her direction throughout all my PhD project, for the help she gave me in preparing for the comprehensive exam, and for the time she spent in reviewing my manuscripts.
When I started my work in the Magnetic Resonance Spectroscopy (MRS) laboratory at the Montreal Neurological Institute, I had no knowledge of MR technology. It was Dr. Douglas Arnold who introduced me to this advanced technology and has been continuously supervising me throughout my thesis work. He was very supportive at the beginning of my project when I have no idea of how to analysis our time serial multimodal image data. He allowed me plenty of time to find out the appropriate methods. Working in the MRS lab is hard and enjoyable. I still remember so many revisions Dr. Arnold made for each individual research proposal and manuscript we have worked on. It is also unforgettable for the pleasure shared by the MRS group when our proposal was approved or when our manuscript was accepted.
I have always found statistics complicated. Although this is still true for me, now I can see its interesting aspects as well. I have greatly benefited from discussions with Professor Keith Worsley and from his constructive advices. There were so many breakthrough ideas he gave during each discussion that at the end he always added ``life is too short...''. I hope that I will have an opportunity work on more of his suggestions in the future.
I want to thank Dr. Paul Matthews, who had been working at the MRS group for 2 years. He has given me great help during my thesis work and has spent tremendous amount time correcting my manuscripts and adding thoughtful input. I really enjoyed my work with Dr. Nicola De Stefano who started at the MRS group at the same time as I did. He has given me so much knowledge on neurology and on the pathology of Multiple Sclerosis. During my work, whenever I had a question, Sridar Narayanan was always available and able to answer it. His broad knowledge in physics, computer science, and medicine has benefited all our MRS group and I thank him for this.
I can never forget the help from Mrs. Arlene Cohen, which started from the first day I came to Montreal. She is the coordinator of the follow-up study of Multiple Sclerosis patients and has contributed a great amount of her time to this study. I also want to thank her for her valuable personal help.
I want to thank Dr. J. Antel and Dr. G. Francis for their cooperation in the study and for their thoughtful suggestions to this study in the monthly MS meetings.
I also gratefully acknowledge Dr. Alan Evans' NeuroImaging laboratory of the MNI for offering image segmentation and registration software for MS studies.
The study was supported by grants from the Multiple Sclerosis Society and the Medical Research Council of Canada.
I want thank the donors to the McGill Alma Mater Fellowship. Their generous support was essential for me to complete my study.
Multiple sclerosis (MS) is one of the most common neurological disorders that affecting young adults [48]. Although the etiology of MS is still not clear, it is believed that people who are genetically susceptible to MS and encounter one or more causal, environmental factors experience an autoimmune reaction which results in demyelination of the central nervous system (CNS) [22].
Patients afflicted with MS usually experience relapses and remissions following the initial attack. This stage of disease referred to as the relapsing remitting (RR) is characterized by recurrent attacks with neurological deficits that resolve completely or partially. The majority of patients ultimately enter a chronic progressive stage (CP) in which they experience continual worsening of the disease and become significantly disabled. These patients are classified as secondary progressive (SP) patients. Whether the SP phase is simply the result of accumulation of nervous system damage or whether it represents a fundamental alteration in the nature of the disease is a major unresolved question. A small number of patients are chronic progressive from onset and are classified as primary progressive.
The prevalence of MS is high in Canada (80/100,000 in Ontario, 93/100,000 in B.C., 55/100,000 in Newfoundland) [48]. As a lifelong disease of early onset, MS is one of the commonest causes of major neurological disability amongst people under age of 50 years.
The symptoms of MS include weakness, depression or absence of deep reflexes, muscle wasting, fatigue. Mental abnormality and intellectual degeneration, although underestimated before, are also present in MS.
MS is a neurological disorder characterized by demyelination of the central nervous system (CNS). The evolution of MS lesions in the brain is complex and still not definitely understood. This is likely due to the difficulties in accessing the human brain during life. However, experimental animal studies and indirect data from neuroimaging studies have contributed greatly to the understanding of the pathology of MS [20] [49] [27].
Epidemiological evidence suggests that the initial trigger of MS is a viral infection or some other stimulus to immunopathological response [22]. People susceptible to MS may have a more vigorous response to this trigger and this results in more widespread injury in the CNS. As MS is predominantly a CNS disease, myelin proteolipid protein (PLP) and myelin-oligodendrocyto glycoprotein (MOG), which are located specifically in the CNS, are the potential autoantigens associated with the immunopathological response [73].
The initial injury to the CNS manifest as cellular immune response is the earliest histologically identifiable event [73] in MS and is referred to as inflammation. Neuroimaging data have shown that demyelination also occurs at the very beginning of the MS lesion initialization but is very likely secondary to inflammation [49]. Typically inflammation lasts for about one month and disappears.
It has been shown through electrophysiological and neuroimaging studies that the signal conduction of previously myelinated neurons will be delayed due to the demyelination and blocked due to the inflammation [49]. Thus, the clinical expressions of MS are associated with both demyelination and inflammation. The relapses seen in RR patients are believed to reflect a combination of the inflammation and demyelination. Remyelination has been observed but is not complete due to either the repeated attacks in acute lesions or the reduced oligodendrocytes in chronic lesions which prevent membrane reproduction. However the partial recovery of neuron function can be achieved by an increase in sodium channels at the demyelinated part of the axons and this may be the major mechanism involved in remission in RR MS [49].
Apart from inflammation and demyelination, axonal changes are known to occur but are usually de-emphasized. Animal experimental studies have shown that axonal changes were involved in acute events such as new MS lesion establishment or enlargement of old lesions associated with inflammation [66]. This has been verified by neuroimaging data [1][42][46][51][59][26]. Furthermore, in many chronic lesions, axonal degeneration exists as a result of the long-term demyelination [67]. Current evidences suggest that axonal degeneration will cause the irreversible neurological deficit of MS [36] [18].
In general, MS lesion development can be characterized as repeated attacks to myelin and axons by immune response, followed by incomplete reparation. This finally results in chronic plaques with profound loss of oligodendroglial cells, gliosis, chronic demyelination, and neuron loss.
MS lesions, containing primarily demyelinating plaques but also inflammatory edema, are multi-focal and variable with respect to size and stage of temporal evolution. Optic nerves, periventricular white matter, and spinal cord are frequently involved.
Most current treatments for MS have focused directly on halting or diminishing the destructive inflammatory process in CNS [81] - if the inflammatory process could be stopped at an early stage, it likely would prevent the almost irreversible demyelination and irreversible neuron damage. Due to the practical problems associated with using of neurological disability as an outcome measure, many studies have used MRI lesion load as a supplementary outcome measure. However, the existence of axonal degeneration and loss presents an additional therapeutic challenge for MS [53] [55]. Neuron damage is not directly visible on conventional MRI. For example, in Wallerian degeneration, the neuron damage may go beyond the initial injured part of neurons and recovery of MS plaques does not necessarily indicate the neuron recovery. As the neuron damage is thought to be the source of the irreversible neurological deficit [49], a new index able to monitor the functional changes of neurons is needed in combination with a measure of clinical disability and MRI lesion load. The MR spectroscopy techniques discussed below offer this possibility.
The need for a reliable system to record the impact of MS on patients and to characterize the nature history of the disease has prompted many researchers to develop different clinical rating scales. However, none of them has been universally accepted. The Kurtzke extended disability status scale (EDSS) [40] has been the most widely used method of clinical assessment in MS. The original scale (DSS) had 11 grades from 0 to 10. It was extended by dividing each grade in two to increase the sensitivity. The final scale of EDSS is based on eight functional system (FS) grades and the ability to walk. The low grade in EDSS (0.5-4.5) is determined by the combination of scales evaluated with FS subsystems. The high scale EDSS ( > 4.5) is determined by the motor disability. Thus EDSS essentially measures both function impairment and motor disability.
One disadvantage of combining functional impairment and motor disability is that it complicates the evaluation procedure and, as a result, reduces the inter-rater agreement. The sensitivity of EDSS in the high grade range is biased toward ambulation because mild functional impairment will unlikely affect motor disability.
There are several other scales: some of them focus on motor disability (e.g. Ambulation index); others are used to record more detailed clinical information by providing multiple indices (e.g. Cambridge multiple sclerosis basic score (CAMBS)) [69]. The former have improved inter-rater agreement but are not sensitive to functional impairment. The later are very useful in evaluating clinical condition of individuals but are not suitable for nature history studies.
Although widely used, EDSS has been criticized primarily for its (1) nonlinear nature, (2) emphasis on motor disability and insensitivity to psychological, visual, and other impairment, and (3) high inter-rater variability [53]. Other laboratory indices may be able to overcome the above difficulties and may also be specific to different aspects of the MS pathology. Most of these indices are based on MR technologies. They can be combined with neurological assessment to investigate the progression of MS and to evaluate the effect of potential treatments.
Neuroimaging studies, especially those implementing MR technologies, have greatly improved our understanding of the MS pathology. This is largely due to the ability of MR technologies to access micro-phenomena inside the human brain.
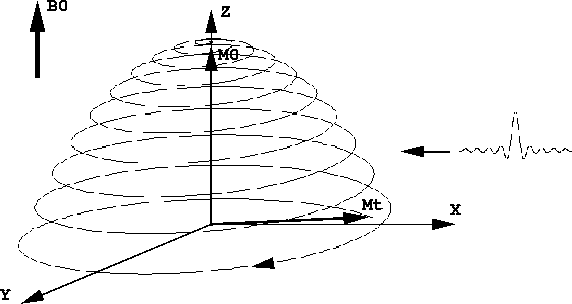
The majority of MR technologies implemented in MS studies are based on protons - the hydrogen nuclei. A protons is associated with a spin angular momentum and thus a proportional magnetic moment which is referred to as spin. The spin orientation is random if no magnetic field is applied. According to quantum mechanics, within a static magnetic field, a hydrogen proton can only exist in one of two states, which possess different energy levels. Assuming within a static magnetic field, usually called B field, pointing upward, a spin will precess at a so-called Larmor frequency and will point either upward (the low energy state) or downward (the high energy state) along the magnetic field. Under equilibrium condition, the proportion of spin up and spin down is governed by Boltzmann equation (which says that a spin will be in a higher energy state with lower probability). Adding all spin vectors together results in a small net magnetic moment pointing upward per unit volume. The difference in energy level between the two states is proportional to the strength of the magnetic field B, so is the net magnetization.
The Larmor frequency associated with protons is proportional to
the strength of B and is also called the resonance frequency.
A transition between the two states of a spin
is only possible if an oscillating magnetic field at the Larmor
frequency is applied perpendicular to the B field. This causes
resonance. Since there are slightly more spins in the lower energy
state than in the higher one, there will be a net absorption of
energy from the applied oscillating field which reduces the net
difference of spins between the two energy states. Applying an oscillating
magnetic field will also drive
the nuclear magnets processing synchronously.
Accordingly, the net magnetization, which is previously
parallel to the external static magnetic field
will be tilted out of the alignment
with B by a so called nutation angle, ![]() . Applying an oscillating
field to rotate the net magnetization away from the static magnetic field
is referred to as excitation and is shown in Figure 1.1. The
approach to excitation involves applying a radiofrequency (RF)
signal to a RF coil. This RF signal is termed a "pulse".
For example, if a RF signal is induced to tilt the net magnetization by
. Applying an oscillating
field to rotate the net magnetization away from the static magnetic field
is referred to as excitation and is shown in Figure 1.1. The
approach to excitation involves applying a radiofrequency (RF)
signal to a RF coil. This RF signal is termed a "pulse".
For example, if a RF signal is induced to tilt the net magnetization by
![]() degree, we say that a
degree, we say that a ![]() pulse has been applied.
In most cases, excitation is accompanied by gradient magnetic fields
(in addition to B) turned on in one or
more directions in space. This is called volume selection (or localization) which
causes only a selected portion of sample being excited.
MR Images of different modalities
can be obtained by applying a combination of different RF excitation
signals (pulse sequence) and gradient magnetic fields.
pulse has been applied.
In most cases, excitation is accompanied by gradient magnetic fields
(in addition to B) turned on in one or
more directions in space. This is called volume selection (or localization) which
causes only a selected portion of sample being excited.
MR Images of different modalities
can be obtained by applying a combination of different RF excitation
signals (pulse sequence) and gradient magnetic fields.
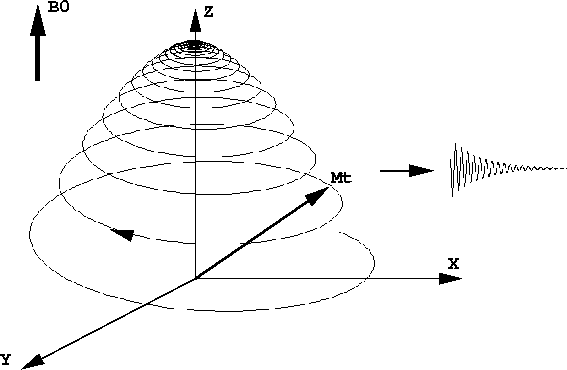
After excitation, the net magnetization will have two components: one perpendicular to and still precessing around the static field (the transversal magnetization) and the other parallel to the B field (the longitudinal magnetization) (Figure 1.2). The transversal magnetization will induce an RF signal which is detectable by a receiving coil. This signal can be used to create MR images. Again, gradient fields can be applied after excitation in order to reconstruct the MR images.
The disappearance of the transversal magnetization is called the
spin-spin relaxation or T2 relaxation and can be characterized by an exponential
decay function with a time constant, T2. In real situation,
due to the magnetic field inhomogeneity and chemical shift (discussed
below in 1.4.3), the disappearance of this component is much faster and usually
is characterized by T2 ![]() (T2
(T2 ![]()
![]() T2). The characteristic time for
returning to thermal equilibrium is called the spin-lattice relaxation time
(T
T2). The characteristic time for
returning to thermal equilibrium is called the spin-lattice relaxation time
(T ![]() ). The spin-lattice relaxation is described by the exponentially increase of the longitudinal
magnetization. The T
). The spin-lattice relaxation is described by the exponentially increase of the longitudinal
magnetization. The T ![]() and T
and T ![]() relaxation processes are the principal contributors to image contrast in MRI.
Conventional MRI is based mainly on the difference in T1 and T2 of different tissues.
Other MR imaging techniques including contrast enhancement MRI, MR
spectroscopic imaging which exploit additional characteristics of proton.
relaxation processes are the principal contributors to image contrast in MRI.
Conventional MRI is based mainly on the difference in T1 and T2 of different tissues.
Other MR imaging techniques including contrast enhancement MRI, MR
spectroscopic imaging which exploit additional characteristics of proton.
The strength of conventional MRI is its ability to create images of different contrasts for tissue structures. There are T1, T2-weighted, and proton-density (PD) weighted MR images. The contrasts of those image modalities depend on T1, T2 relaxation time, and the water proton concentration respectively.
Spatial information contained in an MR image is obtained by implementing excitation pulse sequences and gradient magnetic fields. To select one slice from a sample, a gradient field parallel to the external B field is applied during excitation, resulting in only one slice of the sample being excited. The determination of another dimension in space can be achieved by applying a gradient field when RF signals are collected. This is called the "gradient encoding". The last dimension in space is determined by applying a gradient field after excitation but before signal acquisition. Because this results in spins at different location in the last dimension to have different phases, it is called the "phase encoding". Phase encoding is repeated at a fixed time interval (TR) with gradient field of different magnitudes. The signals being collected contain spatial information of the sample but is ``encoded'' in Fourier space (i.e. k-space). To reconstruct the 2 dimensional image, the data are ``decoded'' into real space (image) by 2 dimensional Fourier transformation.
Knowing how MR image is created,
the next is how to obtain MR images of
different contrasts. This is based on another MR phenomenon, the
spin echo. As discussed above, in real situation, the spin-spin relaxation
is governed by the characteristic
constant of T2 ![]() instead of T2 (T2
instead of T2 (T2 ![]() T2
T2 ![]() ). This fast decay is due primarily to the field
inhomogeneity and chemical shift. However, if a pulse sequence is applied
at TE/2 after excitation, which tilts the net magnetization by a
nutation angle of 180
). This fast decay is due primarily to the field
inhomogeneity and chemical shift. However, if a pulse sequence is applied
at TE/2 after excitation, which tilts the net magnetization by a
nutation angle of 180 ![]() , then after a same time interval, TE/2,
the net transversal magnetization will echo back with decay
determined by T2 (Figure 1.3). Here TE is the echo-time which is a key parameter in
MRI and MRS examinations.
Usually, MR imaging
is based on this spin echo signal instead of the signal induced right
after the excitation.
Spin echo enables us to create MR images of
different contrasts by choosing different echo-time (TE) and repetition time
(TR) [60]. For example, T1 weighted MRI can be obtained by choosing short TE
with TR
, then after a same time interval, TE/2,
the net transversal magnetization will echo back with decay
determined by T2 (Figure 1.3). Here TE is the echo-time which is a key parameter in
MRI and MRS examinations.
Usually, MR imaging
is based on this spin echo signal instead of the signal induced right
after the excitation.
Spin echo enables us to create MR images of
different contrasts by choosing different echo-time (TE) and repetition time
(TR) [60]. For example, T1 weighted MRI can be obtained by choosing short TE
with TR ![]() T1. T2 weighted image can be obtained with long TR and
TE
T1. T2 weighted image can be obtained with long TR and
TE ![]() T2.
T2.
T1, T2 weighted, and proton-density weighted MR images of an MS patient are shown in Figure 1.4. MS lesions appear hypo-intense relative to normal white matter in T1 weighted images but hyper-intense in T2 weighted images with much more striking contrast. MRI lesions are generally defined as regions appearing hyper-intensive in T2 weighted images and thus also referred to as T2 hyper-intensive regions. Cerebrospinal fluid (CSF) in brain also appears hyper-intense in T2 weighted images but it can be differentiated from MS lesions in PD images in which it appears hypo-intense.
MRI lesions represent reversible acute demyelination, edema, inflammation, irreversible chronic demyelination, neuronal loss, and gliosis. They are not specific to either of those underlying disease pathologies [53] [55]. One approach to increase the specificity of MRI to MS pathology is the gadolinium diethylenetriamine penta-acetic acid (Gd-DTPA) enhancing MRI. The mechanism of this approach is based on the paramagnetic properties of gadolinium (Gd), which acts as a local magnetic field that enhances T1 and T2 proton relaxations. Gd is chelated to DTPA and, in normal situation, cannot cross the blood brain barrier (BBB). It is thus excluded from CNS. When the BBB is defective due to MS pathologies (i.e. inflammation), signal enhancement can be seen on T1 weighted images due to the fast recovery of the longitudinal component of the net magnetization. Studies have demonstrated that Gd-DTPA enhancing lesions are associated with inflammation preceding the development of visible MRI lesions. This suggests that inflammation is a primary event in lesion evolution [34].
Protons bound in different molecules experience magnetic fields different from water protons. This is because of the small secondary field generated by electrons from adjacent atoms. Thus the resonance frequency of those protons are shifted by a small amount proportional to the strength of the secondary magnetic field, which in turn, depends on the molecule structures. Proton MRS exploits this physical property of chemical shift and allows quantification of different chemical components in the brain. MR spectroscopic imaging combines MRS technique and MR image reconstruction methodology to obtain the spatial information on the concentrations of chemical components. That is, for each voxel in space, there will be a spectrum associated with it indicating concentrations of a variety of chemical components at the voxel location. Despite the similarity between conventional MRI and MRSI, there are several issues specific to MRSI worth discussing. They are: MRS localization, water suppression, and MR signal overlap.
(1) MRS localization
Many MRS experiments
only collect spectra from a rectangular box inside the brain instead of
a serial of image planes in MRI experiments. One purpose of focusing on a box
inside the brain is to eliminate signals from subcutaneous fat and bone
marrow which will otherwise interfere with metabolite information.
However, this requires selective excitation to take care
of all three dimensions in space. There are currently two promising
approaches for MRS localization: the stimulated echo sequence
(STEAM sequence) and the double spin echo technique (PRESS sequence).
The STEAM sequence comprises three orthogonal slice selective 90 ![]() pulses, each excites protons in a slice in the corresponding direction.
It creates a stimulated echo from protons at the intersection of the
three slices which is the rectangular box. In the PRESS sequence,
instead of three 90
pulses, each excites protons in a slice in the corresponding direction.
It creates a stimulated echo from protons at the intersection of the
three slices which is the rectangular box. In the PRESS sequence,
instead of three 90 ![]() pulses, a 90
pulses, a 90 ![]() pulse was followed by two
180
pulse was followed by two
180 ![]() pulse.
One advantage of PRESS sequence is its high signal to noise ratio (SNR) which is
crucial in MRSI studies. In this project, PRESS sequence is used for MRS localization.
pulse.
One advantage of PRESS sequence is its high signal to noise ratio (SNR) which is
crucial in MRSI studies. In this project, PRESS sequence is used for MRS localization.
(2) Water suppression
In living tissue, metabolite concentrations are at least several thousands times lower than water. Reliable methods able to access the disease chemical pathology depend on successful suppression of interfering water signals. Commonly used techniques include excitation and selective inversion of the water signal. It basically reduces the longitudinal magnetization of water proton to zero before the excitation of the volume of interest for MRS acquisition. This technique is implemented in this project. [44].
(3) MR signal overlap
Technically, sources that contribute to the MR signal representing one voxel in MRSI are not limited to that voxel. Chemical components from adjacent voxels may also contribute to the MR signal because of the point spread function of the MRSI. This is called MR signal overlap. It complicates MRSI data analysis. For example, changes in metabolite concentration in one voxel may cause changes in MR spectra of its neighbour voxels. Data analysis methods able to handle MR signal overlap will be developed in this thesis.
The major significance of using MRS and MRSI in MS studies is to infer the underlying chemical pathology based on concomitant chemical changes detectable by MR. Proton MRS can be divided into short and long echo-time spectroscopy. Short echo-time proton MRS detects signals with short T2 relaxation times, such as lipids, inositol, and amino acid, whose changes are associated with myelin breakdown. Studies using this technology have shown that the demyelination is the early event of MS lesion development [83] [10] [39]. A major problem in implementing short echo-time MRSI is the low SNR due to the fast signal decay associated with short T2. There are very few short echo-time MRSI studies.
Figure 1.5 shows a water suppressed, long echo-time proton MR spectrum from a normal human brain. Three major resonances are present: one at 3.2 ppm that arises from tetramethylamines (mainly from choline-containing phospholipids) (Cho), one at 3.0 ppm that arises primarily from creatine (or phosphocreatine) (Cr), one at 2.0 ppm that arises from N-acetyl groups (mainly N-acetylaspartate) (NAA).
NAA has been considered as a neuronal marker [58], [37]. Immunocytochemical studies of rats [56] [70] have confirmed that NAA is present in axons. Cell culture studies have demonstrated the location of NAA and revealed its presence in two other cell types, oligodendrocyte type 2 astrocyte progenitor and immature oligodendrocytes, which have only minor contributions to the total NAA content in adult brain. Thus, it is well accepted at present that the changes in brain NAA reflect neuronal pathology exclusively. The increase of Cho may reflect the breakdown of membrane [46] [42] which may be associated with acute demyelination in MS.
One problem common to clinical MRS studies is the difficulty in obtaining the absolute concentrations of chemical metabolites. The area under the peak of one spectrum is proportional to the chemical metabolite concentration but it also depends on the system load and localization methods implemented. One solution is to use an external reference during MRS examination. This, however, complicates the MRS examination. Another approach is to use an internal reference - a chemical metabolite whose concentration is believed to be constant. The relative concentrations of other metabolites are obtained by dividing their peak areas by the peak area of the internal reference.
In MS, the total Cr concentration is relatively constant throughout the brain and tends to be relatively resistant to change [] [46]. It has been used in many studies as an internal reference for spectrum quantification. In this thesis, the NAA/Cr ratio is used to represent the relative concentration of NAA in brain. However, regional variations in Cr have been reported in the maturing human brain [75] [9] and this has to be taken into consideration in data analysis.
epsf
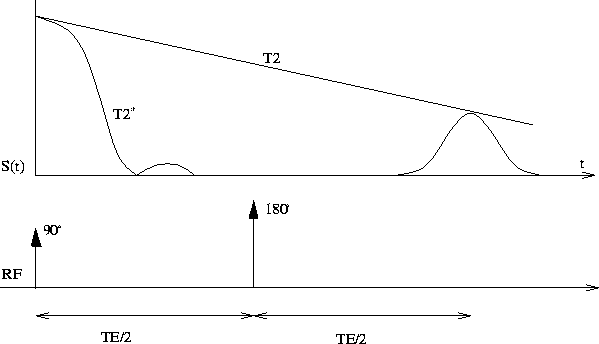
Figure 1.3: Spin echo with a 180 ![]() RF pulse.
This is repeated during MR experiment with repetition time of TR.
For T1 weighted image, TR
RF pulse.
This is repeated during MR experiment with repetition time of TR.
For T1 weighted image, TR ![]() T1 and
TE is set short to reduce T2 effect.
For T2 weighted image, a long TR is chosen to avoid T1 contrast and
TE is set close to T2 to optimize T2 contrast.
T1 and
TE is set short to reduce T2 effect.
For T2 weighted image, a long TR is chosen to avoid T1 contrast and
TE is set close to T2 to optimize T2 contrast.
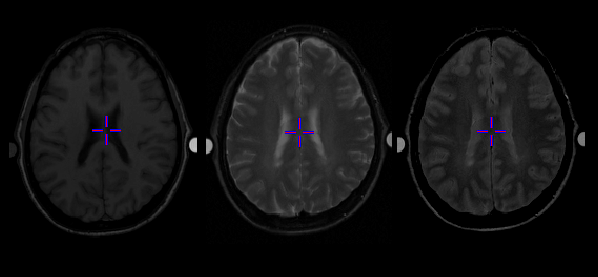
Figure 1.4: T1, T2 wighted, and proton-density MRI of a MS patient. The MS lesions are hypo-intense in T1 and
hyper-intensive in T2 weighted MRI. Proton-density MRI allows differenciation between MS lesions and
regions containing cerebrospinal fluid.
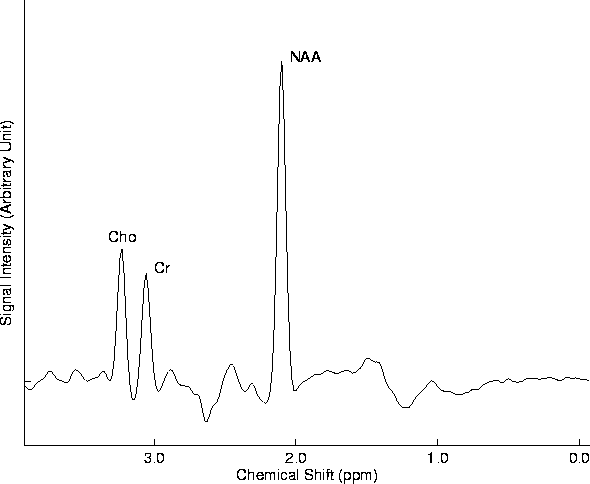
Figure 1.5: Long echo-time spectroscopy of a normal control. Major chemical componds are:
N-acetylaspartate (NAA), choline-containing phospholipids (Cho),
and creatine (Cr).
Lipid peak may be visible in acute MS plaques in short echo-time
MRS at 0.9 and 1.3 ppm.
It is extremely difficult to adequately define the nature history of MS. This is because that the time course of MS is so variable and may involve multiple physiological mechanisms. Early postmortem studies showed that inflammation and demyelination co-existed in the CNS of MS patients. Axonal changes were known to occur but were not prominent and were usually de-emphasized. How these physiological mechanisms contribute to the disease progression in MS was unknown due to the inaccessibility to the living brain in pathological studies. This situation has been changed radically during the last decade with advances in MR technologies that allow for non-invasive monitoring of the pathological changes in vivo.
Effective treatments of MS come with a better understanding of its underlying pathology. To assess the effectiveness of a treatment presents another challenge. While any effective treatment should be finally judged based on clinical outcomes, the insensitivity of clinical scales for MS makes them unsuitable in small to moderate studies aimed at nominating putative cures. The high sensitivity of MR measures to MS pathological changes have proved themself good candidates of supportive outcome measure in clinical trials.
A review of contributions of MR technologies to our understanding of MS pathology follows. MR methodology is versatile, however, the focus of the following literature review is on studies implementing MRI and MRS techniques. Other techniques may have perspectives in accessing different aspects of MS pathology that MRI and MRS lack. Their contributions will be mentioned briefly.
Because of the insensitivity of neurological evaluations (e.g. EDSS) to MS progression [28], serial MRI studies have been carried out to monitor the disease activity in the CNS of MS patients. In one serial MRI study of 7 RR MS patients, 4 patients were clinically stable, but eighteen new and ten enlarging MRI lesions were seen in five patients [29]. It had been shown that there were much more MRI evidences than clinical evidences for disease activity. In this study, patients were followed for six months at 4-week intervals. During the follow up, the sizes of some old MS lesions increased, and new MS lesions developed. These MRI activities could not be associated with any clinical evidence. Later, another study designed in a similar fashion with more frequent MRI examinations (every 2 weeks) was carried out on 9 RR MS patients [82]. The chance was higher in this study to capture new MRI lesions. It also could more precisely characterize the temporal profile of MS lesion development. Results showed that the new MS lesions reached a maximum size in approximately 4 weeks before gradually shrinking, usually leaving a small residual abnormality indistinguishable from chronic MS lesions. It also confirmed that there was a high occurrence frequency of new asymptomatic lesions: 12 asymptomatic new lesions had been observed in 6 patients during six months.
While relapsing remitting is an important characteristic of MS, most disabled patients, however, will eventually progress to a chronic progressive (CP) course. A small part (18%) of MS may begin with chronic progressive. It was suspected that the chronic CP phase might represent a change in the nature of the underlying disease progression. For example, the newly developed MS lesions might be much less than that in RR patients observed previously and the clinical disability might be due to other mechanism. To confirm this hypothesis, a follow up study of eight clinically definite CP MS patients was conducted [38]. Seven of them had started with relapsing disease (secondary progressive (SP)) and one had CP disease from onset (primary progressive (PP)). MRI exams were taken biweekly for 6 months. Outcomes were numbers of active and regressing MS lesions. The active lesions was defined as either new, reappearing, or enlarging MS lesion. Regressing lesions were those that had either disappeared or shrunk since the previous MRI exams.
Despite the clinical inactivity: there were no clinical relapse and disability ratings did not change between the start and completion of the study, a total of 86 active events (new, reappearing, and enlarging lesions) were identified by MRI over the six months. Six patients had experienced at least one occurrence of simultaneously enlarging and regressing lesions. The time course of enlargement and subsequent regression of the lesion was typically a rapid increase in size to reach maximum in about 4 weeks followed by a more gradual decline in size over the subsequent 4 to 8 weeks. 40% of the new lesions had totally resolved while 98% of the old lesions did not. In contrast to the clinical appearance, the disease activity in CP group as evaluated by MRI lesion was higher than that in RR patients previously observed.
It is possible that the difference in clinical expression between the two clinical subgroups is caused by MRI activities in the spinal cord and brain stems. This is based on the fact that most brain lesions do not directly contribute to locomotor disability, which is the major determinant of the clinical outcome in the relapsing MS patients. To test this hypothesis, a follow up study of 29 MS patients with serial cranial and spinal cord MRI was carried out [80]. In this study, MS patients were classified as stable, mild relapsing, mild progressive, and moderate relapsing MS. MRI exams were taken at the beginning of the study and at week 13 and 26 during the follow up. Extra MRI exams were also taken by patients who had encountered a relapse. Clinical assessment was performed preceding each MRI exam. In general, there was an agreement (not statistically significant) between MRI and clinical assessments: the sensitivity of MRI activity to the clinical outcome was 93% and the specificity was 63%. However, when MRI and clinical activities were localized to specific pathological sites of optic nerve, spinal cord, cerebellum, stem, and hemisphere, it was found that the clinical and MRI concordance was very poor. For example, most brain lesion activities could not be attributed to any disease activity as assessed by clinical judgment. There was an approximately equal occurrence of asymptomatic MRI changes in the spinal cord and cerebral hemisphere. No difference in MRI lesion activity was found between RR and CP patients.
The above serial MRI studies might suggest that although clinical expression was clearly different between relapsing and progressive diseases, there might be no fundamental difference between the active relapsing and the active progressive MS. However, the pathophysiological heterogeneity of MRI lesions might be another reason of not being able to differentiate the two clinical subtypes by MR lesion activity. This was supported by another study implementing magnetic resonance spectroscopy (MRS) technology which is more specific to the underlying pathology of MS [47]. Furthermore, pathophysiological heterogeneity of regions that appear normal on MRI needs to be investigated too.
The pathophysiological heterogeneity of MRI lesions has been appreciated in both in vivo and in vitro studies [49]. Unlike conventional MRI, which can not differentiate between inflammation, demyelination, and gliosis, Gd-DTPA enhancing MRI lesions reflect the blood-brain barrier break down which is believed to be the earliest detectable event in the MS lesion development [74]. To detect active MS lesions based on frequent serial MRI exams is not practical in large studies and is subject to error as it requires comparison between two consecutive MRI exams. To reliably detect new developed MS lesions can be better achieved by Gd-DTPA enhancing MRI.
Despite the high reversibility of Gd-DTPA MRI lesions which is closely related to the acute inflammation in CNS, their effect on the temporary clinical outcome is expected as inflammation was found to be a cause of nerve conduction block [49]. The relationship between Gd-DTPA MRI lesions and clinical activity was examined in a study of 9 patients with mild relapsing remitting multiple sclerosis (Expanded Disability Status Scale < 3.5) [72]. Patients had taken about 24 to 37 monthly Gd-DTPA MRI scans, neurological examinations, and EDSS score assignments. A significant association was observed between these periods of clinical relapse and MRI parameters, including increases in total number, number of new lesions, and the total area of enhancement. This confirmed an important relationship between clinical activity and cerebral Gd-DTPA MRI activity.
Increased frequency of enhanced brain lesions during clinical relapse was also observed in several other studies [74] [82].
The underlying pathology for the relationship between Gd-DTPA lesion activity and clinical relapse is that the nerve conduction is interrupted by acute inflammation which causes relapse. As the inflammation has recovered, the nerve conduction will resume and patient enter a remitting phase. This is probably the reason for the observed correlation between MRI (or Gd-DTPA enhancing MRI) lesion activity and clinical relapse. While the relationship between the short term clinical activity (i.e. clinical relapse) and the MRI (or Gd-DTPA enhancing MRI) lesion activity is of interest in understanding the disease progression, it is more important to investigate the impact of MS lesion activity on the long term clinical disability. Some studies have been focused on the correlation between the MS lesion activity and clinical evaluation of EDSS.
Early studies showed little or no relationship between brain MRI lesion load and clinical disability [53]. Small number of study subjects and short period of follow up may explain the weak clinical/MRI correlation in those studies. In a multi-center study of 281 MS patients followed for more than 2 years [19], statistical significant correlation between the changes in EDSS and changes in MRI lesion load (number of new and enlarged MS lesions) was found. Subgroup analysis showed that this correlation only existed in RR MS but not in SP. This study indicated that the correlation was still quite weak (R = 0.13, p = 0.02) probably because of the heterogeneity of the patients with respect to the stage of disease, disease duration, and the patients' disability at the entry of the study. MRI outcomes and EDSS scales were assessed by different raters which might also explain the weak EDSS/MRI correlation.
The lack of a strong correlation between MRI lesion activity and clinical outcomes may simply reflect the insensitivity of clinical scales being used in the above studies. Despite the lack of a clear relationship between the MRI lesion activity and clinical disability, the high sensitivity of MRI (and Gd-DTPA enhancing MRI) shown in previous studies had prompted the use of MRI lesion activity as a secondary outcome measure in clinical trials of MS.
In a double-blinded, multi-center trial with 372 relapsing remitting (RR) MS patients, patients were either treated with interferon beta or placebo [28]. It was found from the two year follow up that the relapse rate was reduced significantly in the treatment group as compared with the placebo group. The treatment effect was also shown by the secondary outcome of MRI lesion load (the total MRI lesion volume). Although there was a significant correlation between the total lesion volume and the clinical disability in the study, EDSS did not show any significant treatment effect. A subgroup of the patients has been followed more closely with 6-week MRI examination. It had been found that the number of exams which showed either new, recurrent, or enlarging lesion was 80% (p = 0.0026) less in treatment group than in the placebo group. This is consistent with the finding of relapsing rate.
In another randomized, double-blinded, placebo-controlled, multi-center trial of 301 RR MS, time to sustained progression of disability, the primary outcome, was significantly greater in the treatment group [30]. However, no difference in the MRI lesion activity was found between the two groups.
In summary, MRI has presented us, for the first time, a efficient way to non-invasively assess the abnormality of the CNS of MS patients. Studies in the field had contributed significantly to our understanding of the pathology of MS. MS disease activity detected by serial MRI and Gd-DTPA enhancing MRI is higher than it appears clinically. The high sensitivity of MRI lesions enables us to use MRI as an objective outcome measure in clinical trial of MS. It can help us to select potential treatments of MS in relatively short period of time with less study subjects.
There are two major concerns for using MRI to define the nature history of MS pathology. First, MS lesions are heterogeneous in that it contains irreversible demyelination, gliosis and reversible acute demyelination, inflammation and edema. New MS lesions detected by frequent serial MRI and Gd-DTPA enhancing MRI studies reflect acute inflammation that is almost totally reversible and may not contribute to the long term disability. Most studies that showed a correlation between MRI lesion activity and clinical activity may reflect the short term effect of inflammation on the clinical outcome. The long term effect of MRI activity needs to be investigated. Second, brain tissues that appear normal in MRI exams may also contain pathological changes. in vitro study showed that the myeline sheath is thiner in macroscopically normal white matters and axonal shrinkage has been observed in some part of the normal appearing white matter. Other new MR technologies have enabled us to access a variety aspects of the MS pathologies in both MS lesions and NAWM. Among those new technologies, magnetic resonance spectroscopy (MRS) is very useful and has been employed by many studies.
Despite the high activity of MRI lesions, they provide limited information on MS disease pathology and metabolite changes. Magnetic resonance spectroscopy (MRS) is promising as it defines simultaneously a number of chemical components whose changes can be used to infer the chemical pathology of MS. These chemical components include N-acetyl aspartate (NAA), choline-containing component (Cho), and lipid from methyl and methylene groups. Lipid signals observed in short echo-time MRS are related to demyelination. The pathological significance of Cho in MS is uncertain. It has been suggested that changes in Cho are related to demyelination on the grounds that compounds that constitute Cho peak are required for myelin synthesis and are derived from its catabolism [45]. NAA is found exclusively in neurons. Changes in NAA concentration can be used as an ideal index of axonal dysfunction or volume loss and may be used as an index of changes associated with persistent pathological evolution of MS lesions.
Metabolite changes associated with lipid and Cho Short echo-time MRS detects signals with short T2 relaxation times such as lipid. The potential of short echo-time MRS in detecting active demyelination in MS has been demonstrated in several studies [39] [83] [10]. In a study of 12 MS patients and 24 normal controls [39], more Gd-DTPA MRI lesions showed lipid peak than conventional MRI lesions, indicating that the presence of lipid peak was associated with demyelination which was undergoing at the early stage of MS lesion evolution. No elevation of lipid peak was seen in controls in this study. In another study combining short echo-time MRS and Gd-DTPA enhancing MRI, 20% of MRI lesions showed lipid peaks while 50% of Gd-DTPA enhancing MRI lesions showed lipid peaks [83], confirming an association between presence of lipid peak and early inflammatory/demyelinating process.
Increases of Cho resonance have been observed in MS patients [46] [11]. In a serial MRI/MRS study of a single MS patient started 3 days after disease inception, increases in Cho were found preceding decreases in NAA, a neuronal marker [5]. This suggested that axonal pathology might be a result of demyelination to the CNS. In this study, the relationship between the increase of Cho and demyelination was confirmed by biopsy. The time course of Cho changes was found to be correlated with the acute MRI lesion progression.
In one study of eight MS patients and eight controls followed for 4-9 months, Cho was found increased significantly in MRI lesions. During the follow up, Cho signal has returned to control level in five out of eight MS lesions. Cho signals from outside MS lesions were normal.
Experimental studies [7] [11] showed that a large increase in Cho could be produced by the increased membrane turnover associated with inflammatory cellular infiltration. Thus the observed increase of Cho in the brain of MS can be interpreted as evidence for active demyelination. It is worth noting that changes in lipid and Cho reflect the active demyelinating process. Accumulated demyelination can be better visualized with magnetization transfer (MT) imaging [24].
Decreases of NAA in MS lesions Irreversible neurological deficit in MS depends ultimately on the loss of the ability of axons conduct. The mechanism that produce this is not fully understood. The histology of chronic lesions suggests that one possibility for conduction block is persistent demyelination. This possibility, however, is not straightforward; evoked potential studies have shown that acute conduction block with its consequent functional loss which characterizes the new lesion is usually reversible, probably due to an increase in the number of sodium channels from the nodes into the inter-nodal axon. Remyelination may contribute to the reversibility of functional loss but it is not essential since good recovery of vision may occur despite persistent and often marked delay in the visual evoked potentials. The failure of these compensatory mechanisms, perhaps as a result of repeated episodes of demyelination in the same fibers, would contribute to irreversible functional loss.
A second possibility for irreversible neurological deficit in MS is axonal loss and damage. There are several evidences, although not decisive, that support this assumption. (1) Pathological studies have shown that axons in demyelinated plaques were reduced in number and diameter [64]. (2) Evidence of Wallerian degeneration has been found in areas of the cervical spinal cord of MS patients [36]. The severity of Wallerian degeneration was found to be correlated with patients' clinical expression. (3) Quantitative NMR study showed an expansion of the extracellular space which could be attributed to axonal loss [18]. The expansion of the extracellular space was more evident in highly progressive patients.
Proton MRS presents a non-invasive way to access axon pathology in the CNS of MS. The normal proton spectrum is dominated by N-acetylaspartate (NAA) which has been shown in experimental studies to be contained exclusively within neurons [76]. A loss of neurons would be predicted to cause a persistent reduction in the NAA concentration. It has been hoped that NAA concentration in the CNS of MS patients may be used as a sensitive measure of persistent functional deficit.
In a study of 7 MS patients, NAA intensity was lower in patients than in normal controls [1]. There was a trend of correlation between the disease severity and NAA reduction. Another interesting finding was that the spectrum from an acute plaque was normal while chronic plaques showed large reductions in NAA. This suggested that MRS could differentiate between chronic and acute lesions. The difference in NAA concentration between acute and chronic MS lesions had been confirmed by another study of two MS patients [51]. In one patient who had an old chronic astrocytic plaque verified by biopsy, proton spectra showed a significant drop of NAA peak. In contrast, in another patient who had a newly developed MS lesion suggested by clinical evidence and verified by serial MRI, only milder reduction of NAA intensity was found. However, when Gd-DTPA enhancing MRI was implemented, no difference in NAA concentration was found between enhancing and no enhancing lesions [23]. It might be because that there was a significant regional overlap between enhancing (active) and no enhancing (chronic) lesions such that partial volume effect from nearby chronic lesions had reduced the NAA intensity in enhancing lesions and diluted the difference. Different from this study, large, separated new acute lesions were identified in the previous two studies [1] [51].
In a study of 48 MS patients and 16 normal controls, NAA was found decreased and Cho increased in old MS plaques [42]. Metabolite concentration in very acute plaque was normal. Increase in Cho in chronic plaques might imply that demyelinating process was undergoing although it could not be seen in conventional MRI. In consistent with previous studies, the age of MS plaque was correlated with NAA reduction in MS plaques.
The definition of acute and chronic plaques in some of the above studies was based on clinical observations which, due to the lack of correlation between MS lesions and clinical symptoms, might be incorrect. In a study of 13 MS patients, the age of MS plaques was determined according to serial MRI observations [46]. Significant reduction of NAA in chronic MS plaques was found. No difference in NAA intensity was found between acute MS plaques and normal appearing white matter of the same patients. The difference between acute and chronic MS plaques might be the result of the progression of neuronal pathology, it also suggested that the neuronal pathology might have extended to NAWM. This study also confirmed that Cr was relatively constant during the pathologic evaluation of MS lesions and that reduction in NAA might not be explained by changes in magnetic relaxation time.
The difference in NAA intensity between acute and chronic MS lesions observed in the above studies demonstrates the heterogeneity nature of the disease pathology in MRI lesions and suggests that MRS has an advantage over conventional MRI in quantifying the pathology changes in MS lesions.
While comparing the difference between chronic and acute MS plaques in cross-sectional studies had offered insight into the progression of neuronal pathology of MS lesions, a better understanding of MS lesion progression can be achieved in follow up studies. In a case study of one MS patient who had a single biopsy-proved inflammatory demyelinating lesion, the patient was followed from the 3rd day after onset for 8 months [3]. Six MRI/MRS exams were taken during the follow up. Data showed that in the center of the MS lesion, NAA signal had been decreasing constantly over time and stayed at the lowest level by the end of the study. In areas where MRI showed abnormal at the beginning but had become normal during the follow up, NAA was also reduced. In normal appearing white matter, however, NAA signal had decreased and later increased to almost the original level. Magnetic resonance spectroscopic imaging was implemented in this study so that regions of interest can be defined retrospectively for analysis. In addition to the time course of NAA changes in the acute plaque described in this study, it also demonstrated that the metabolic changes could vary in different parts in MS lesions and the disease pathology might even extend outside the lesion. The observed progressive decrease in NAA/Cr is in consistent with previously observed difference between active and long standing astrocytic lesions.
The time course of NAA changes in acute MS lesions had been investigated in several other studies. In contrast to the above case study, several early studies also found that NAA reduction after initial attack were recoverable [2] [12] [16]. These conflict findings, again, illustrated the heterogeneity in MS lesion progression.
Correlation between NAA changes and clinical expression The typical initiation stage of MS is characterized by slow but progressive recovery of neurological functionality following the first severe acute attack at the disease onset. The mechanism of this functional recovery (i.e. clinical remission) could be attributed to either resolution of MS lesions or recovery of damaged axons. With its ability to access axonal pathology in MS, MRS had been combined with MRI to study this functional recovery mechanism. In one study, 4 acute MS patients had been followed longitudinally from the onset of clinical symptoms for a minimum of 7 months to a maximum of 3 and a half years [16]. During the follow up period, clinical disability was evaluated for correlation of functional recover with brain MRI lesion volume and MRS indices. Initial MR exams indicated that, in addition to the overall decrease of NAA in MS lesions in all patients, more decreases of NAA intensity were found in patients with severe symptoms. This trend was not shown in MS lesion volume. Follow up exams showed that both NAA concentration and brain lesion volume were highly correlated to the patients' EDSS scale. Data also indicated a strong correlation between NAA intensity and MRI lesion volume. It was not possible from the data obtained in this study to tell either MRI lesion volume or NAA decrease was the primary cause of the functional disability. Another finding in this study was the confirmation of metabolite abnormality in the normal appearing white matter in patients: NAA intensity was reduced in the NAWM surrounding the acute lesion. Comparison of NAA intensities in NAWM between lesion side and the contralateral hemisphere showed that the NAA reduction in NAWM was not caused by NMR signal overlaps.
The above studies were focused on MS lesions most of which were acute. It is, however, more important to study the neuronal pathology in regions that covers both lesions and normal appearing white matter because MS lesions only occupy a relatively small portion of brain volume. Many evidences have suggested that brain tissues that appear normal in MRI exams might be abnormal microscopically [49] [64]. MRS can imaging axonal pathology in NAWM and allows us to define the disease progression in the CNS of MS.
To characterize the progression of axonal pathology in the CNS of MS, seven patients with clinically definite MS were followed for 18 months with MRI and MRS exams taken at 6 month intervals [5]. Instead of positioning the VOI on any individual MS lesion, the VOI was centered on the corpus callosum and covered a relatively large intersection of the brain. 4 of those patients had disease characterized by recurrent relapse (RR). The clinical deterioration of 3 other patients was more progressive and thus these patients were characterized as chronic progressive (CP) MS. Results showed that the average signal intensity ratio of NAA/Cr had decreased significantly with time. This decrease was monotonic in progressive patients which was consistent with the gradually increasing severity of disease. In contrast, in RR patients, increases in NAA/Cr were also observed between some consecutive MRS exams. NAA intensity was correlated with the total lesion volume but not the lesion volume in the volume of interest where the MRS signal was collected. This, again, suggests that axonal abnormality exists in the NAWM. There was no correlation between NAA changes and clinical disability because EDSS did not change during the follow up.
While the relationship between axonal pathology changes and clinical improvement is evident during functional recovery after initial onset in acute MS, it is more important to investigate this relationship in chronic cases where persistent functional deficit dominates. However, unlike acute cases where functional impairment can be exclusively attributed to a single localized acute lesion, pathology in chronic MS are multi-focal and may involve spinal code which can not be easily accessed by MRS technology. As a result, the relationship between clinical disability and MRS parameter of the CNS will be less strong in chronic MS than that in acute MS. In addition, progression of clinical disability in chronic patients is relatively slow. Thus, correlation between clinical expression and MRS parameters is not expected in short follow up studies. After all, lack of sensitivity of EDSS to the underlying pathological changes is another important reason of not being able to find a correlation between clinical disability and neuronal index of NAA in the above study [5]. For this reason, studies had been focus on comparing groups of MS patients that were clearly separated according to their clinical expressions.
To investigate the contribution of NAA reduction to clinical outcomes, Davie et. al. had compared 4 groups (each had eleven subjects) of patients and controls: group 1 according to the functional cerebellar scale had marked cerebellar deficit for 1 year (sever ataxia MS); group 2 of MS patients with minimal or no signs of cerebellar deficit; group 3 of patients with disease characterized pathologically as extensive loss of neurons; and group 4 of normal controls [11]. MRS signal was obtained from a VOI located to the cerebellar white matter to optimize the sensitivity of MRS to the cerebellar deficit. Results showed that in the MS patients with severe ataxia, there was a highly significant reduction of NAA in the cerebellar white matter compared with controls. In contrast, the NAA intensity in MS patients without cerebellar deficit showed no significant difference from the control group. The reduction of NAA in the patients with extensive neuron loss was the same as the MS patients with severe ataxia. This study demonstrated that NAA was a valid measure of axon dysfunction which in turn might contribute to the clinical expression. Data from this study also suggested that the reduction of NAA in regions being studied was caused at least in part by the NAA changes in the NAWM: NAA reduction did not correlate to the MS lesion volume in the VOI where MRS signals was collected.
Most chronic MS patients can be classified as either relapsing remitting (RR) or secondary progressive (SP). SP is considered as a later stage of MS. If persistent axonal damage exists in MS, we can expect that NAA intensity is lower in SP than in RR patients. However, in a study of 29 MS patients (11 RR and 18 SP) [47], brain proton MRS showed that the NAA/Cr ratio was reduced to a similar level in the two clinical subgroups. The MRI lesion volume was greater in RR than in CP MS, despite the longer disease duration of of SP patients. The higher lesion volume and similar NAA level in RR as compared with SP suggested that the mean degree of axonal loss or damage per unit lesion volume is higher in the SP group. Although lower NAA intensity in NAWM of SP patients could also contribute to the observation of this study, this could not be verified in this single voxel MRS study. This study was designed to match the MS patients to most concurrent clinical trials. As a result, the clinical disability of the two MS group was similar. This may be the reason of failure to find a difference of NAA between the two groups.
Neuronal pathology in NAWM The metabolic abnormality in regions that appear normal in MRI has been suggested in many of studies some of which are mentioned above. The first one that worth of mention is a MRS study of 17 normal controls and 18 MS patients (in which 15 were MRI positive). Data showed a significant reduction of NAA/Cr in MRI positive MS. The decrease in NAA did not depend on the relative plaque volume inside the volume of interest where the spectrum were collected from. This suggested that the decrease of NAA had extended into the normal appearing white matter surrounding the MS plaques [77].
Study of NAWM in MS is difficult because the reduction of NAA in NAWM is relatively small. Partial volume effects from MS lesions and ventricles also interfere with the spectrum signal from NAWM. Most previous studies used single voxel MRS which provided little information concerning the heterogeneous nature of MS lesions and normal appearing white matter of individual patients. MRSI techniques provide spectral data simultaneously from numerous volume within the brain, enabling separate in vivo biochemical observations of MS lesions and NAWM from single patient examination.
In an MRSI study of 13 clinically definite MS patients and 19 normal controls, spectra from different regions in the CNS were obtained for comparison [27]. Results showed that in both MS lesions and NAWM of patients with MS, NAA/Cr was significantly reduced compared with controls. The reduction of NAA in this study had been considered to be associated to Wallerian degeneration in which the neuron dysfunction will go from the initial injury to the cell body which might not be attacked directly. The decrease of NAA in NAWM was also found in another study of 22 clinically definite MS patients [68].
The possibility that partial volume effect from MS lesions may affect the NAA signal from NAWM has not been totally eliminated in the above studies. It was also suspected that changes in Cr, although very unlikely, might have contributed to the reduction of NAA/Cr in NAWM [61]. Nevertheless, the reduction of absolute NAA concentration in NAWM of MS patients had been found in a postmortem study [13]. In this study, tissue from postmortem MS and normal control brain was extracted and analyzed with MR spectroscopy. Partial volume effects from lesions and ventricle were eliminated by tissue extraction. It was also found that changes in NAA in NAWM did not correlate with the distance form MS lesions. This might imply that changes in NAWM reflect accumulative attacks other than attacks associated to any current specific lesion.
Pathology of multiple sclerosis involves inflammation, demyelination, and neuronal dysfunction which can be visualized in vivo by magnetic resonance technologies. Studies showed that these underlying pathological processes might contribute to disease activity. Their long term effects need to be investigated.
Evidences suggested that the persistent neurological deficit in MS is caused by neuronal loss. Long echo-time MRS is able to assess the extend of neuronal dysfunction based on NAA reduction. Statistical significant correlation between clinical disability and NAA reduction has been found in acute MS patients during recovery. The observed continuous attacks to CNS and persistent disease progression in natural history studies of MS suggested that, in long term, correlation between clinical disability and the NAA reduction could be found in chronic MS.
Different from acute MS patients where disease progression can be attributed to a single lesion, pathology changes in chronic MS may involve multiple lesions of different stages. in vitro studies showed that axonal involvement is not limited to the macroscopic lesions. Although smaller, pathological changes in NAWM (non macroscopic lesions) may also have significant effect on clinical expression because of the large volume of NAWM relatively to macroscopic lesions.
Studies of NAWM of MS have shown the importance of neuronal pathology in NAWM. Questions need to be answered are: (1) the time course of NAA changes in NAWM as compared to that in MS lesions; (2) contribution of NAA changes in NAWM to disease outcomes. This requires systematic study of NAWM that is able to take into consideration the partial volume effects and MR signal overlaps. Because changes in NAWM are relatively small, study of large number of patients and longer follow up is needed in order to answer the above questions.
While MR imaging techniques present an opportunity to access the underlying pathology of MS, efficient statistical methods have to be developed to analyze MR imaging data. In most former studies, multiple spectra from individual MRSI were selected either from normal appearing white matter (NAWM) or from MS lesions. t-test or ANOVA type statistics were then applied for the comparison between MS patients and normal controls or between NAWM and MS lesions. There are several disadvantages associated with the above analysis:
(1) Only spectra from selected voxels in MRSI are analyzed. Valuable information from unselected voxels is neglected.
(2) Selection bias may exist if researchers know the status of the study subjects. This is unfortunately true because both MRSI and MRI have to be accessible when select voxels in the MRSI.
(3) The intra-subject correlation due to the fact that more than one voxel are selected from single MRSI of individual subject has not been taken into consideration.
(4) As size of MS plaque can be as small as less than 1 mm in diameter, it is very possible that voxels selected from MS lesions contains part of normal tissues. This partial volume effect has not been taken into consideration.
(5) MR signals coming from voxels at different locations may not be comparable because of the variation of metabolite concentration unrelated to any disease pathology. Matching the voxel location is difficult because of the multi-focal feature of MS pathology.
(6) Generally, voxels in MR images are not well defined. MR resonance signal representing one voxel in image may come from both the voxel volume and regions surrounding that voxel. This is the so called MR signal "bleeding". It means signals from voxels close to each other are strongly correlated. Appropriate statistics able to take into consideration this aspect of MR images have to be implemented.
In statistical literature, statistical methods for correlated data have been widely discussed [41] [6] [31]. Most of them were applied to 1-dimensional cases. Among them, unbalanced repeated measure models presented by Jennrich and Schluchter [31] is more appropriate than the others for 3 reasons:
(1) Dependent variables are described as arbitrary linear functions of unknown regression parameters.
(2) A variety of the correlation functions to choose.
(3) Time-varying variables and incomplete data can be treated appropriately.
In this thesis, this method will be extended to spatial and spatial-temporal cases for imaging data analysis. Difficulties in image data analysis discussed above can be overcome by this extended method.
The high activity of MRI lesion load makes it a good candidate in monitoring MS disease progression. The presence of a correlation between MS lesion load and clinical disability in several recent studies supported the notion that MRI could be used as an alternative outcome measure in treatment trials of MS [28] [17] [78] [72] [21]. However, given the pathophysiological heterogeneity of MS lesions and the existence of microscopic lesions invisible in MRI, there is a particular need to implement other MR techniques specific to a variety of MS pathologies. The important MS pathologies include inflammation, demyelination, and axon loss and damage. Among them, loss and damage to axons is a major, although generally under-emphasized, part of the pathology of MS. Studies have shown that axon loss or damage exists in both acute and chronic MS lesions [67] [66]. There are evidences suggesting that axonal degeneration leads to the of irreversible neurological deficit [36] [18]. Long echo-time MRS and MRSI based on NAA resonance intensity offer an opportunity to monitor the axonal pathology in MS.
Focused on NAA changes in MS lesions, previous studies have found a consistent decrease of NAA in acute and chronic MS lesions [1][42][46][51][59][26] and suggested that NAA can be used as an index of neuronal recover as well as an index of the accumulation of irreversible disability [3] [11] [14].
Correlation between the improvement of the clinical disability and increase of NAA intensity has been observed in acute plaques [16]. However, to investigate the relationship between clinical disability and NAA changes in chronic cases is of potential importance because it may reveal the dependence of the irreversible neurological deficits on the accumulated neuronal loss and damage. This will support the hypothesis that brain NAA intensity is an useful outcome measure in treatment trials of MS.
In some studies, decrease of NAA in NAWM was also found [27] [3]. The reduction of NAA in NAWM can be associated with both invisible microscopic MS lesions and Wallerian degeneration of neurons from MS lesions visible on MRI. The decrease of NAA in NAWM may have more significant contribution to the clinical outcome given the relatively large volume of NAWM compared to MS lesions.
Previous clinical studies of MS using MRS techniques were generally short in time for investigation of the disease progression associated to neuronal loss or dysfunction in chronic cases. They are also small in size to evaluate the correlation between axonal pathology and clinical disability and to carry out subgroup analysis. To elucidate MS pathology, chemical information based on MRSI must be integrated with anatomical information based on the water-based MRI, which defines the conventional appreciated MS plaques. Analytical methods must be developed for efficient analysis of image data and to overcome difficulties common to most of previous studies as discussed above in 2.2.
A three year follow-up study of 28 MS patients was conducted at the Montreal Neurological Institute. Serial MRI, MRSI, and clinical examinations were carried out. There were three objectives in this project.
(1) Adopt and extend the random-effects models to spatial and temporal cases for multimodal image analysis.
(2) Apply the statistics to collected MR data and clinical information to answer the follow questions:
(i) What is the relationship between the axonal loss and damage and the MS lesions? Is this relationship different between RR and SP MS?
(ii) Is there a significant difference in the overall rate of progression of NAA/Cr with time between RR and SP patients? If so, does this difference arise from differences in the lesions or in the NAWM?
(iii) Is the decrease of NAA/Cr in NAWM relevant to clinical disability?
(3) Develop a computer package implementing the above statistics to facilitate its use by other research groups in the field. This package will also present functionalities for imaging data organization, image manipulation and visualization.
This work will contribute to the understanding of MS pathology. The new image analysis computer program will help researchers in the field to analyze their data more efficiently.
28 MS patients have been recruited from the MS clinic at the Montreal Neurological Hospital (MNH). They are classified according to clinical course as having either recurrent relapses with partial remission (RR, 11 patients) or secondary, chronic progressive disease (without discrete relapses) after an early history of relapsing and partially remitting disease (SP, 17 patients). They had been followed prospectively for a number of years by the MS clinic. 12 normal controls have been recruited into this study. The demographics of the study patients are shown in the following table:
| RR | SP | |
| No. of patients | 11 | 17 |
| Sex (M:F) | 6:5 | 11:6 |
|
Age (years; mean | 33.5 | 46.8 |
|
Duration of symptoms (mean | 9.7 | 16.2 |
|
EDSS (mean | 5.0 | 5.7 |
| Months since last attack | 15.6 |
Inclusion criteria 1. Age 18-55 years
2. Clinically definite or laboratory supported definite MS [63]
3. Evidence of active disease as defined by progression of at least 2 point on the EDSS over the previous 2 years
4. classifiable as either relapsing remitting or secondary progressive
5. EDSS between 2.5-7
6. Evidence of periventricular white matter disease on MRI
7. Informed consent to study
Exclusion criteria 1. MR examination contraindication (e.g. pacemaker, intracranial aneurysm clips, etc.)
2. Pregnancy
3. Medical contraindication (e.g. unstable co-existent problems)
4. Logistical contraindication (e.g. planning to move away, etc.)
The RR disease is defined as having 2 or more relapses over the preceding 3 years separated by at least 1 month. SP disease is defined as former RR patient whose EDSS increased at least 1.0 over the preceding year without an acute exacerbation. Clinical disability is graded according to the EDSS [40].
To include patients with active disease (Inclusion criteria 3) is to increase the intra-subject variability in order to improve the statistic power of the study. We have attempted to choose patients with disability levels relevant to current clinical therapeutic trials (Inclusion criteria 5).
Clinical Clinical data are obtained by the MS clinic at the MNH. This includes sociodemographic data, clinical subgroup, disease duration and EDSS progression in the previous two years. Clinical follow up will precede each MR follow up examination.
MR examinations MRS and MRI examinations are scheduled as close in time as possible to the clinical evaluation. Subjects are evaluated at approximately 8 month intervals. This study will last for 3 years. Thus for each patient, 5 MR exams will be taken.
MRI methods To minimize errors and artifacts from post-hoc registration (particularly of the low resolution MRSI), heads are registered as precisely as possible a priori. Study of each subject begins with scout views to ensure that the head is centered and not rotated or tilted. The head is repositioned as necessary. Multislice transverse and coronal images are then acquired parallel and perpendicular to the horizontal line using an offset that places the superior margin of the corpus callosum between 2 transverse slices and the anterior margin of the corpus callosum between coronal slices. This ensures that identical slices can be obtained on subsequent examinations.
These images are used to select a volume of interest (VOI) for spectroscopy that is also angled along the horizontal line and is roughly centered on the corpus callosum. The VOI were sized and positioned on the first examination of each patient to be anatomically consistent with the corpus callosum and skull size of that person's head. On subsequent examinations of that person, the VOI dimensions are not altered and the VOI is positioned in the identical location within the brain to the extent possible.
MRI lesion volume is determined from 6mm thick transverse slices, using tissue segmentation and analysis software developed at the NeuroImaging Laboratory of Montreal Neurological Institute (MNI).
MRSI methods Proton spectra are obtained using a 90-180-180 (PRESS) sequence for volume selection. Spectroscopic images are generated with phase encoding in 2 dimensions. Phase error from magnetic field inhomogeneity are corrected by dividing the signal by the signal from a subsequently acquired MRSI without water suppression [25].
MRSIs are created by 3-D Fourier transformation (1 spectral and 2 spatial dimensions) of the above acquired data. Baseline offset is corrected by fitting a seventh order spline through the frequency range of the spectral data that do not correspond to the NAA, Cho and Cr peaks. Peak areas which reflect the metabolite concentrations are determined by a pseudo-expert system that determines peak position and width and integrates above a locally estimated baseline. The locally estimated baseline may be manually adjusted if necessary.
MRI and MRSI are register to a standard space defined by an average (n > 300) 3 dimensional MRI brain volume. This allows combination of anatomical and metabolite information in space. Clinical information collected during the follow up is also used for data analysis.