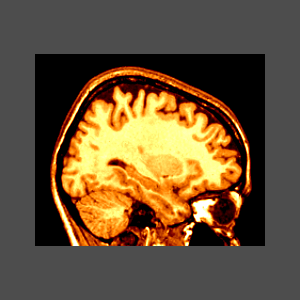

~david/public_bin/make_slice /data/icbm/mri1/new_icbm/subjects/00100/final/mni_icbm_00100_t1_final.mnc slice.obj x w -30 2 2
~david/public_bin/ray_trace -output ex1.rgb -nolight -hot 80000 500000 /data/icbm/mri1/new_icbm/subjects/00100/final/mni_icbm_00100_t1_final.mnc 0 1 slice.obj
Use the -size x_size y_size option.
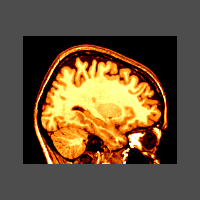
~david/public_bin/make_slice /data/icbm/mri1/new_icbm/subjects/00100/final/mni_icbm_00100_t1_final.mnc slice.obj x w -30 2 2
~david/public_bin/ray_trace -output ex1.rgb -nolight -hot 80000 500000 /data/icbm/mri1/new_icbm/subjects/00100/final/mni_icbm_00100_t1_final.mnc 0 1 slice.obj -size 200 200
Use the -bg colour option.
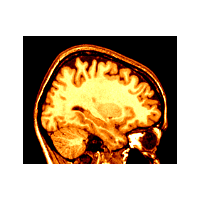
~david/public_bin/make_slice /data/icbm/mri1/new_icbm/subjects/00100/final/mni_icbm_00100_t1_final.mnc slice.obj x w -30 2 2
~david/public_bin/ray_trace -output ex1.rgb -nolight -hot 80000 500000 /data/icbm/mri1/new_icbm/subjects/00100/final/mni_icbm_00100_t1_final.mnc 0 1 slice.obj -size 200 200 -bg white
Use the -over colour_name and -under colour_name option. These two argument only affect subsequent colour coding arguments on the command line, in this case, the -hot ... arguments.
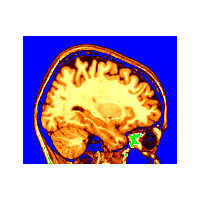
~david/public_bin/make_slice /data/icbm/mri1/new_icbm/subjects/00100/final/mni_icbm_00100_t1_final.mnc slice.obj x w -30 2 2
~david/public_bin/ray_trace -output ex1.rgb -nolight -under blue -over green -hot 80000 500000 /data/icbm/mri1/new_icbm/subjects/00100/final/mni_icbm_00100_t1_final.mnc 0 1 slice.obj -size 200 200 -bg white
Since the default view provides a border around the object, the -crop option is one way to remove the wasted space, by reducing the width of background to 1 pixel. Another way is to explicitly define the view yourself, described later in the tutorial.
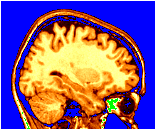
~david/public_bin/make_slice /data/icbm/mri1/new_icbm/subjects/00100/final/mni_icbm_00100_t1_final.mnc slice.obj x w -30 2 2
~david/public_bin/ray_trace -output ex1.rgb -nolight -under blue -over green -hot 80000 500000 /data/icbm/mri1/new_icbm/subjects/00100/final/mni_icbm_00100_t1_final.mnc 0 1 slice.obj -size 200 200 -bg white -crop
A tag file contains points in 3 dimensional space and usually has the suffix .tag. The ray_tracer displays them as spheres. Be careful to put the tag filename on the command line before the -hot option, in order for the tags not to be colour coded by the volume. The colour and size of the tags (if the size is not in the .tag file) are specified by the -marker_size size and -marker_colour colour arguments.
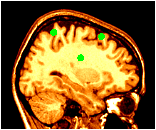
~david/public_bin/make_slice /data/icbm/mri1/new_icbm/subjects/00100/final/mni_icbm_00100_t1_final.mnc slice.obj x w -30 2 2
~david/public_bin/ray_trace -output ex1.rgb -nolight -marker_size 2 -marker_colour green tags.tag -hot 80000 500000 /data/icbm/mri1/new_icbm/subjects/00100/final/mni_icbm_00100_t1_final.mnc 0 1 slice.obj -size 200 200 -bg white -crop
The -light and -nolight turn on and off lighting effects for subsequent objects on the command line. In this example, the tag points have been made larger, and use lighting, but the slice does not use lighting effects.
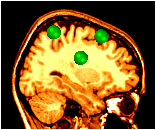
~david/public_bin/make_slice /data/icbm/mri1/new_icbm/subjects/00100/final/mni_icbm_00100_t1_final.mnc slice.obj x w -30 2 2
~david/public_bin/ray_trace -output ex1.rgb -nolight -marker_size 2 -marker_colour green tags.tag -hot 80000 500000 /data/icbm/mri1/new_icbm/subjects/00100/final/mni_icbm_00100_t1_final.mnc 0 1 slice.obj -size 200 200 -bg white -crop
This example shows all regions of PET activation above a certain value on top of an MR image. This is accomplished by putting the -gray MR colour coding on the command line, followed by -under transparent, and finally the -spectral colouring of the PET volume.
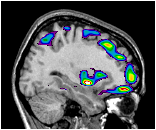
~david/public_bin/make_slice /data/icbm/mri1/new_icbm/subjects/00100/final/mni_icbm_00100_t1_final.mnc slice.obj x w -30 2 2
~david/public_bin/ray_trace -output ex8.rgb -nolight -gray 80000 450000 /data/icbm/mri1/new_icbm/subjects/00100/final/mni_icbm_00100_t1_final.mnc 0 1 -under transparent -spectral 40 60 /avgbrain/brain/images/mni_demo_cbf_normal_pet_tal.mnc.gz 0 1 slice.obj -size 200 200 -bg white -crop
The last argument of the colouring coding argument indicates
the opacity of the volume colours. By changing the argument:
-spectral 40 60 /avgbrain/brain/images/mni_demo_cbf_normal_pet_tal.mnc.gz 0 1
to
-spectral 40 60 /avgbrain/brain/images/mni_demo_cbf_normal_pet_tal.mnc.gz 0 .4
,
the PET image shows a little of the underlying MR image.
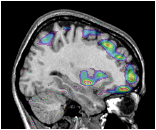
~david/public_bin/make_slice /data/icbm/mri1/new_icbm/subjects/00100/final/mni_icbm_00100_t1_final.mnc slice.obj x w -30 2 2
~david/public_bin/ray_trace -output ex8.rgb -nolight -gray 80000 450000 /data/icbm/mri1/new_icbm/subjects/00100/final/mni_icbm_00100_t1_final.mnc 0 1 -under transparent -spectral 40 60 /avgbrain/brain/images/mni_demo_cbf_normal_pet_tal.mnc.gz 0 .4 slice.obj -size 200 200 -bg white -crop
Surfaces are collections of triangles constituting a 3D surface,
usually in a file with a suffix of .obj. They are rendered
simply by placing the filename on the command line. The default view
is a 3/4 view from the posterior top left
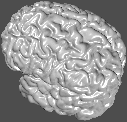
david/public_bin/ray_trace -output ex11.rgb /data/icbm/mri1/new_icbm/subjects/00100/surfaces/mni_icbm_00100_t1_cortex.obj.gz -size 200 200 -crop
Besides specifying a view orientation numerically (described later), there are 6 canonical views which may be chosen: -top, -bottom, -left, -right, -back, and -front.
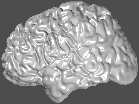
david/public_bin/ray_trace -output ex11.rgb /data/icbm/mri1/new_icbm/subjects/00100/surfaces/mni_icbm_00100_t1_cortex.obj.gz -size 200 200 -crop -left
Pet activations and other volume information may be coloured onto a surface in the same way as coloured slices were created in earlier examples.
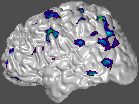
~david/public_bin/ray_trace -output ex12.rgb -under white -spectral 40 60 /avgbrain/brain/images/mni_demo_cbf_normal_pet_tal.mnc.gz 0 1 /data/icbm/mri1/new_icbm/subjects/00100/surfaces/mni_icbm_00100_t1_cortex.obj.gz -size 200 200 -crop -left
Lights may be defined by the use of -directional x y z r g b where x y z defines the direction the light is shining, and r g b define the three colour components of the light, with maximum values of 1. The usual is 1 1 1, which corresponds to white light.
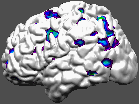
~david/public_bin/ray_trace -output ex12.rgb -under white -spectral 40 60 /avgbrain/brain/images/mni_demo_cbf_normal_pet_tal.mnc.gz 0 1 /data/icbm/mri1/new_icbm/subjects/00100/surfaces/mni_icbm_00100_t1_cortex.obj.gz -size 200 200 -crop -left -directional 1 -1 -1 1 1 1 -directional -1 -1 -1 1 1 1
Cross sections of surfaces are created by the plane_polygon_intersection program to create lines, the set_object_colour program to set the colour, which are then rendered on top of slices.
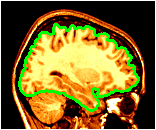
~david/public_bin/make_slice /data/icbm/mri1/new_icbm/subjects/00100/final/mni_icbm_00100_t1_final.mnc slice.obj x w -30 2 2
~david/public_bin/plane_polygon_intersect /data/icbm/mri1/new_icbm/subjects/00100/surfaces/mni_icbm_00100_t1_cortex.obj.gz lines.obj x -30
~david/public_bin/set_object_colour lines.obj lines.obj green
~david/public_bin/ray_trace -output ex14.rgb -nolight -line_width 2 lines.obj -hot 80000 450000 /data/icbm/mri1/new_icbm/subjects/00100/final/mni_icbm_00100_t1_final.mnc 0 1 slice.obj -size 200 200 -bg white -crop -right
Supersampling is a method of computing the colour several times per pixel and assigning the average value. Essentially it smooths the jagged edges that often appear in images. An argument of -sup 3 requires 9 times the computation time as the default (which is -sup 1), but the results can sometimes be subtly more pleasing.
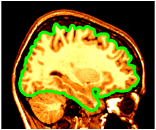
~david/public_bin/make_slice /data/icbm/mri1/new_icbm/subjects/00100/final/mni_icbm_00100_t1_final.mnc slice.obj x w -30 2 2
~david/public_bin/plane_polygon_intersect /data/icbm/mri1/new_icbm/subjects/00100/surfaces/mni_icbm_00100_t1_cortex.obj.gz lines.obj x -30
~david/public_bin/set_object_colour lines.obj lines.obj green
~david/public_bin/ray_trace -output ex14.rgb -nolight -line_width 2 lines.obj -hot 80000 450000 /data/icbm/mri1/new_icbm/subjects/00100/final/mni_icbm_00100_t1_final.mnc 0 1 slice.obj -size 200 200 -bg white -crop -right -sup 3