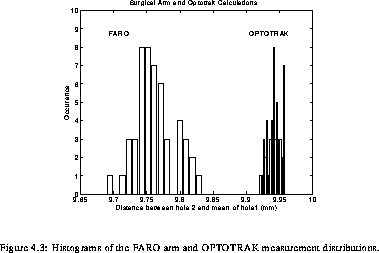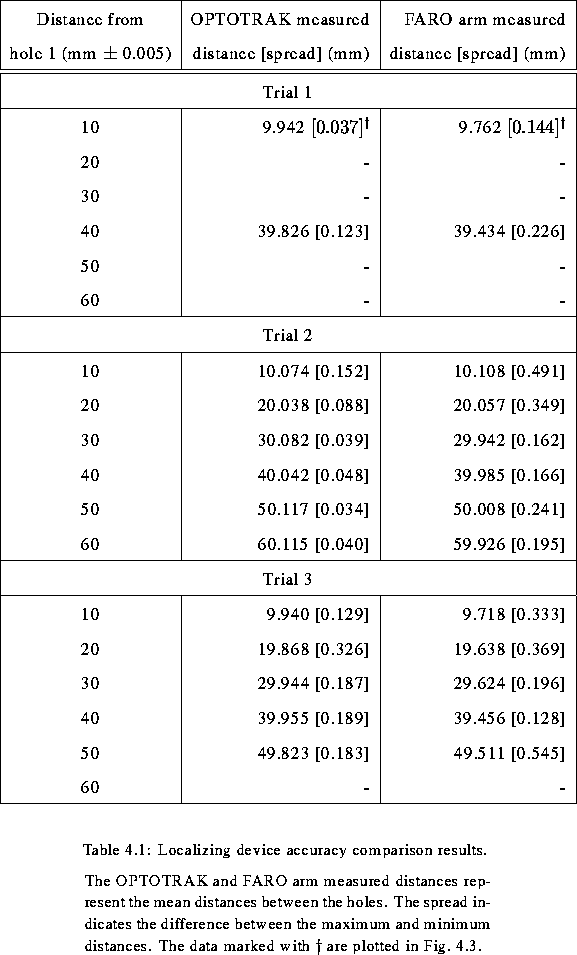
The difference in the measured distances between holes #1 and #2 in Trial 1 is plotted in histo. Both the data generated by the OPTOTRAK and the FARO arms yielded distributions close to the true 10 mm spacing. The first point of interest in this figure is that the OPTOTRAK distribution has a mean closer to the true 10 mm spacing than the that of the FARO arm distribution (within the milling machine's 0.005 mm accuracy). Second, the distribution of the OPTOTRAK measurements have a smaller standard deviation than the FARO ARM distribution. The mean of each of the OPTOTRAK and FARO arm distributions are listed in trial1 along with the spread (i.e., the difference between the maximum and the minimum value) of each.

