
This section will be deleted
MATLAB code: Plot Mean Cortical Thickness as a function of N3
Each time you run a pairwise comparison of N3 values, you can save the thickness values separated out for each N3. You will need to temporarily comment-out (or delete) the “clear” line:
%clear all; close all; clc
In the example in the section above, after the script is run, you would type in the MATLAB command prompt:
T3_50=(T3(1:5,:));
T3_100=(T3(6:10,:));
Next, rerun the script for all other N3 values, e.g., N3=75 vs. N3=125
T3_75=(T3(1:5,:));
T3_125=(T3(6:10,:));
And so on until you have run all N3 values. You may then save all of these values to a single .mat file:
save('N3.mat', 'T3_50', 'T3_75', 'T3_100', 'T3_125', 'T3_150', 'T3_175', 'T3_200')
This .mat file may be used to plot the mean and standard error of cortical thickness as a function of N3 value:
clear all
load N3.mat

Table_tlink = [mean(T3_50')' mean(T3_75')' mean(T3_100')' mean(T3_125')' mean(T3_150')' mean(T3_175')' mean(T3_200')'];
se_tlink = std(Table_tlink)'/sqrt(length(Table_tlink));

figure(1)

plot(mean(Table_tlink), 'ro-')
set(gca, 'XTick',1:7, 'XTickLabel',{'50' '75' '100' '125' '150' '175' '200'})
hold on
errorbar(mean(Table_tlink),se_tlink, 'r') %standard error
ylabel('Mean Cortical Thickness');
xlabel('N3');
set(gcf,'numbertitle','off','name', ['Mean Cortical Thickness as a function of N3']);

figure(2)

plot(se_tlink, 'ro-')
set(gca, 'XTick',1:7, 'XTickLabel',{'50' '75' '100' '125' '150' '175' '200'})
hold on
ylabel('Standard Error of Cortical Thickness');
xlabel('N3');
set(gcf,'numbertitle','off','name', ['Standard Error of Cortical Thickness as a function of N3']);
Output:
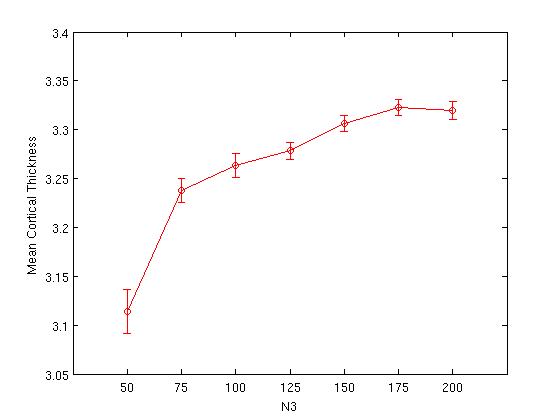
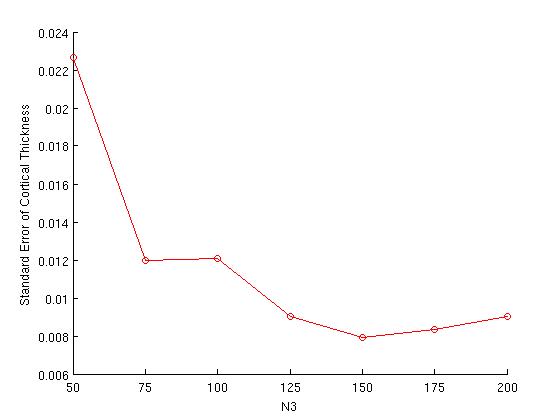
The plot on the right is simply a replot of the error bars from the plot on the left; at this scale, it is easier to see the N3 value at which variance is minimized (in this example, N3=150).
Previous Section: Quality Control
Next Section: Vertex-Based Statistical Analyses
CIVET Home