|
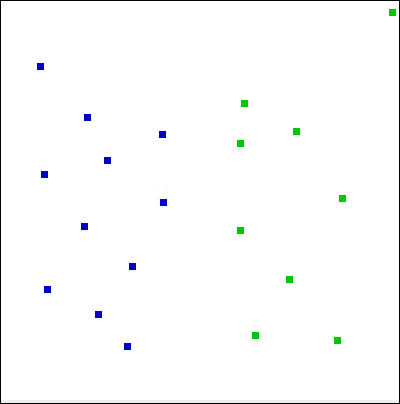
We start with the same set of linearly separable datapoints from the previous section.
A convex hull is easiest to visualize using the rubber band analogy. Imagine that a rubber band is stretched about the circumference of a set of pegs (our points of interest). If the rubber band is released, it becomes wrapped around the pegs resulting in a tight border defining the original set. The resulting shape is the convex hull, and can be described by the subset of pegs that touch the border created by the rubber band.
Now say we compute the convex hulls of the data in each of our two classes. We follow this up by determining the shortest line between any two positions along the convex hulls and drawing the line perpendicular to them.
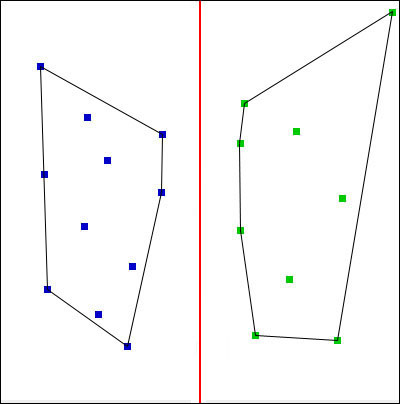
As can be seen in the above image, this results in the same maximum margin as that produced in the previous formalization, but instead uses the concept of convex hulls.
|