This section illustrates the use of MS_reg_error to analyze
homologous point matching registration. The simulation was performed
using Matlab and proceeded through the following steps![]() .
.
 and a translation vector
  were chosen randomly.
 and
and  according to the equation:

Note that the scale was kept unchanged between the two spaces.
 was added to the surgical space points.
 , and
the squared modulus of the registration error for 10 points from 0
to 200 mm along the x-axis was computed. The choice of the
x-axis is arbitrary and of no consequence on the final result
since the average result is independent of the direction of the
vectors in imaging space. The procedure was repeated from step 1.
 and
and  . The square root of these numbers is shown in
reg for different numbers of homologous points and noise
levels (STD). In addition, some graphs of the RMS registration
error as a function of the distance from the origin are presented
in simul_4_2simul_50_3. The solid line
represents the parabola MS_reg_error fit to the data and
the error bar length is twice the square root of the standard
deviation of the squared registration error. The dashed line
represents the fit of VS_reg_error.
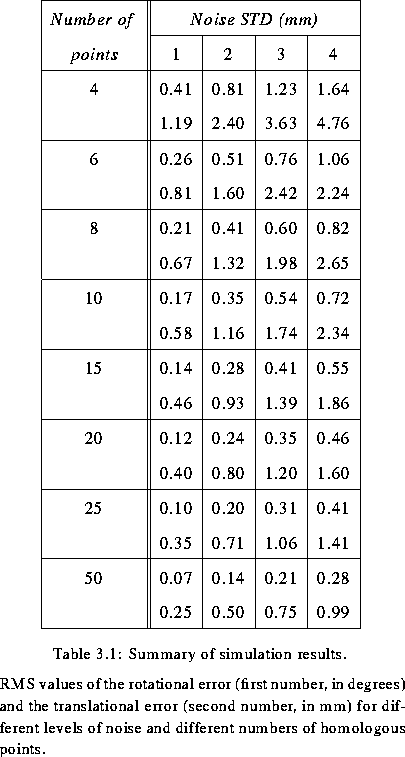
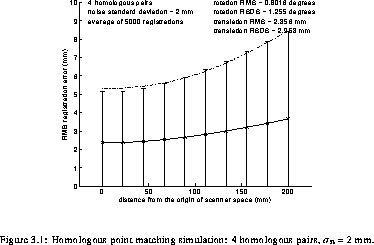
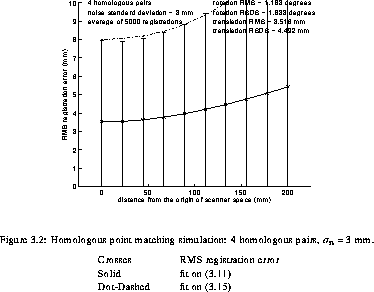
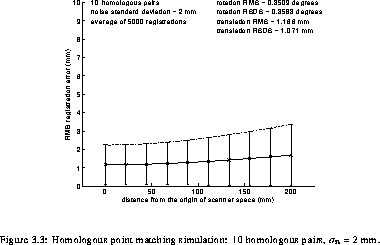
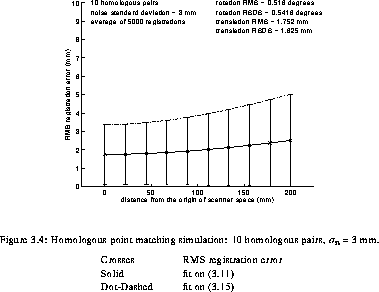
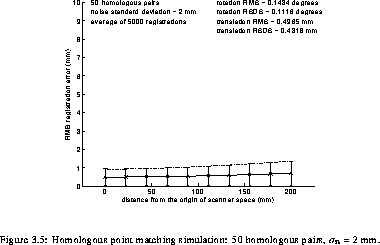
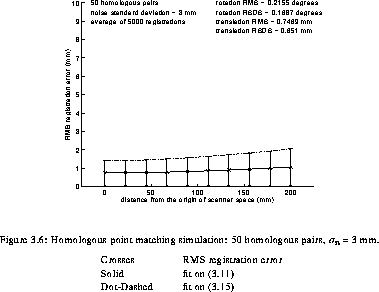
Examination of reg and the graphs clearly shows the reduction of the RMS registration error with the number of homologous pairs observed in Neelin et al. [42]. Furthermore, it can also be observed that the variability of registrations is reduced by increasing the number of homologous pairs used.
In order to verify that  and
and  are
representative measurements of the registration method, plots of the
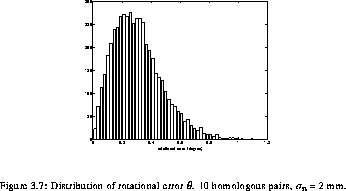
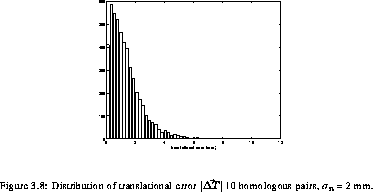
distribution of the rotational and translational errors (for 10
homologous pairs and noise standard deviation of 2 mm), are presented
in hist_rothist_trans. These graphs show clearly that
the mean values of the translational and rotational error have the
highest probability of being observed.
