
See also members in my lab, the EEG/NIRS Laboratory, my recent publications, or news.
Multi FunkIm Research
Using cutting-edge non invasive methods involving simultaneous EEG/MEG, EEG/fMRI and EEG/NIRS recordings, our objectives consist in proposing:
Theme 1: EEG/MEG source localization:
We propose methodology to localize along the cortical surface, electrophysiology data obtained at a millisecond time scale from scalp recordings. This results in solving the so-called inverse problem of source localization. Our main goal consists in the developpment of Maximum Entropy on the Mean (MEM) source localization, in the context of EEG source imaging, MEG source imaging and also EEG/MEG fusion, as the only distributed source localization method able to recover the spatial extent of the underlying generators.
| http://youtu.be/J-zlE3K34dQ?rel=0 | http://youtu.be/XGl6WI882TQ?rel=0 |
| This video shows the steps and the results of Electroencephalography (EEG) source localization for a visual half field paradigm. EEG is a technique that measures the neuronal activity in the brain using electrodes that are pasted on the scalp. It can measure brain signals at every millisecond, however, without advanced mathematical and physical tools it could not provide 3-dimensional (3D) information on the brain. Our research involves fusing the EEG signals -measured with a high-density EEG system (256 electrodes, EGI)- with the 3D anatomical information of the brain, obtained with Magnetic Resonance Imaging, to localize the neuronal activity on the cortex. | Complete multimodal investigation involving MEG source localization, fMRI response and intra-cranial EEG investigation. |
Theme 2: Volumetric NIRS:
Spatio-temporal reconstruction of oxy-hemoglobin (HbO) and deoxy-hemoglobin (HbR) responses. We propose a strategy from EEG/NIRS data acquisition, signal detection to volumetric reconstruction to demonstrate the ability of NIRS to localize, in space and in time, fluctuations of HbR and HbO.
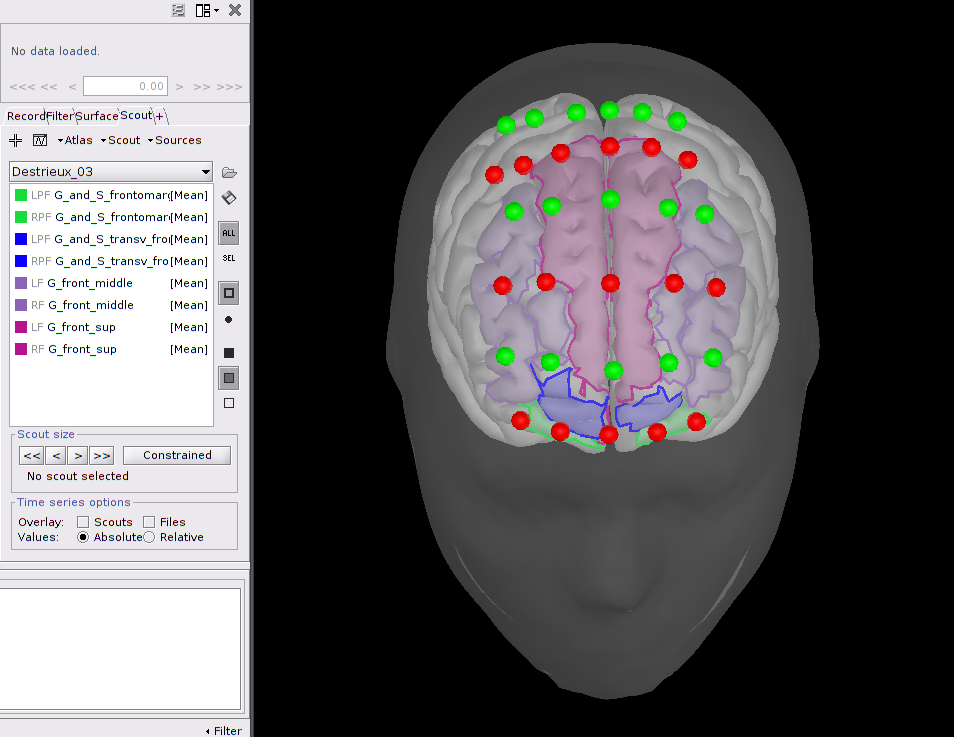 | 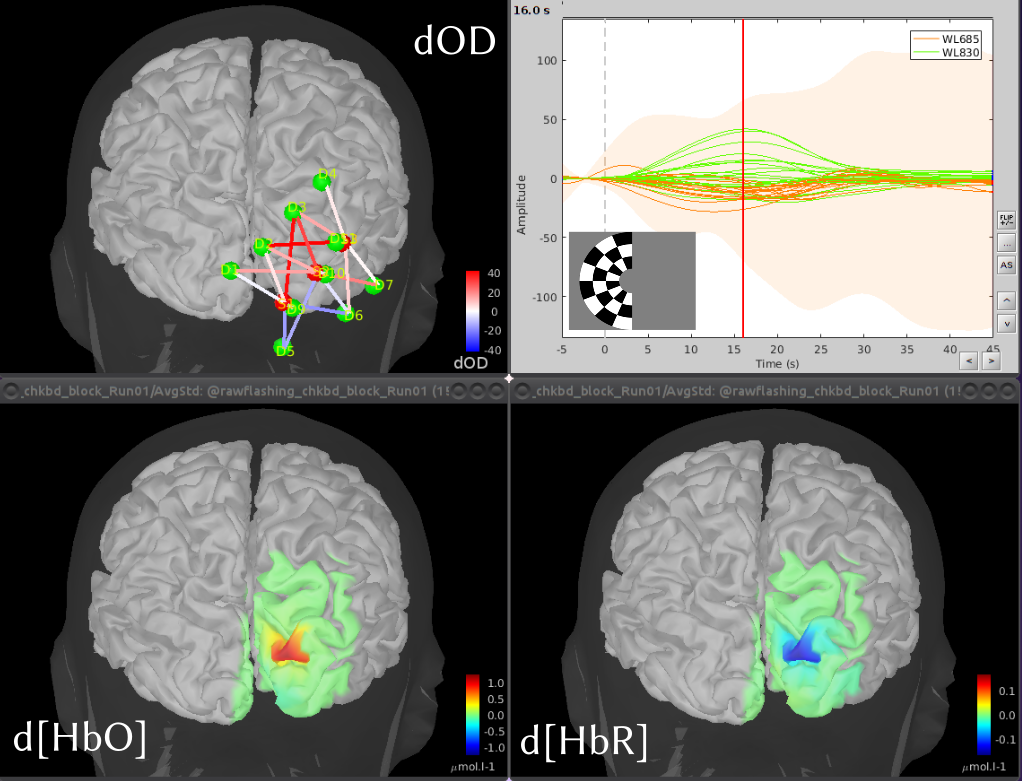 |
| Frontal NIRS montage used for a working memory experiment where optodes are depicted as spheres, with green ones being detectors and red ones emitters. A transparent template head mesh is shown in dark grey, as well as a template cortex in light grey. Finally, an atlas of the pre-frontal cortex is depicted in purple (superior prefrontal), blue (transversal frontal) and green (orbito-frontal). | Coritcal reconstruction of the variations of oxy (HbO) and deoxy (HbR) hemoglobin concentrations, evoked by the visualization of flashing checkerboards. The map on the top left depicts the optimal montage placed on the primary visual cortex. The bottom pictures show reconstructed maps of the maximum evoked HbO and HbR variations. The graph with the time courses shows the temporal hemodynamics variations, evoked by the visual stimulations. |
Theme 3: Multimodal characterization of Neurovascular Coupling (NVC) during normal and pathological conditions
using: (i) EEG/MEG sources to model neuronal bioelectrical input, (ii) fMRI and NIRS data to monitor brain hemodynamic response. NVC is the main principle allowing indirect measurement of brain activity (in fMRI, NIRS or Positron Emission Tomography) exploiting processes linking neuronal activity and brain vascular response. However, these processes are not well-known, especially in pathological conditions. Our objective is to combine multimodal non-invasive data to shed light on NVC processes.
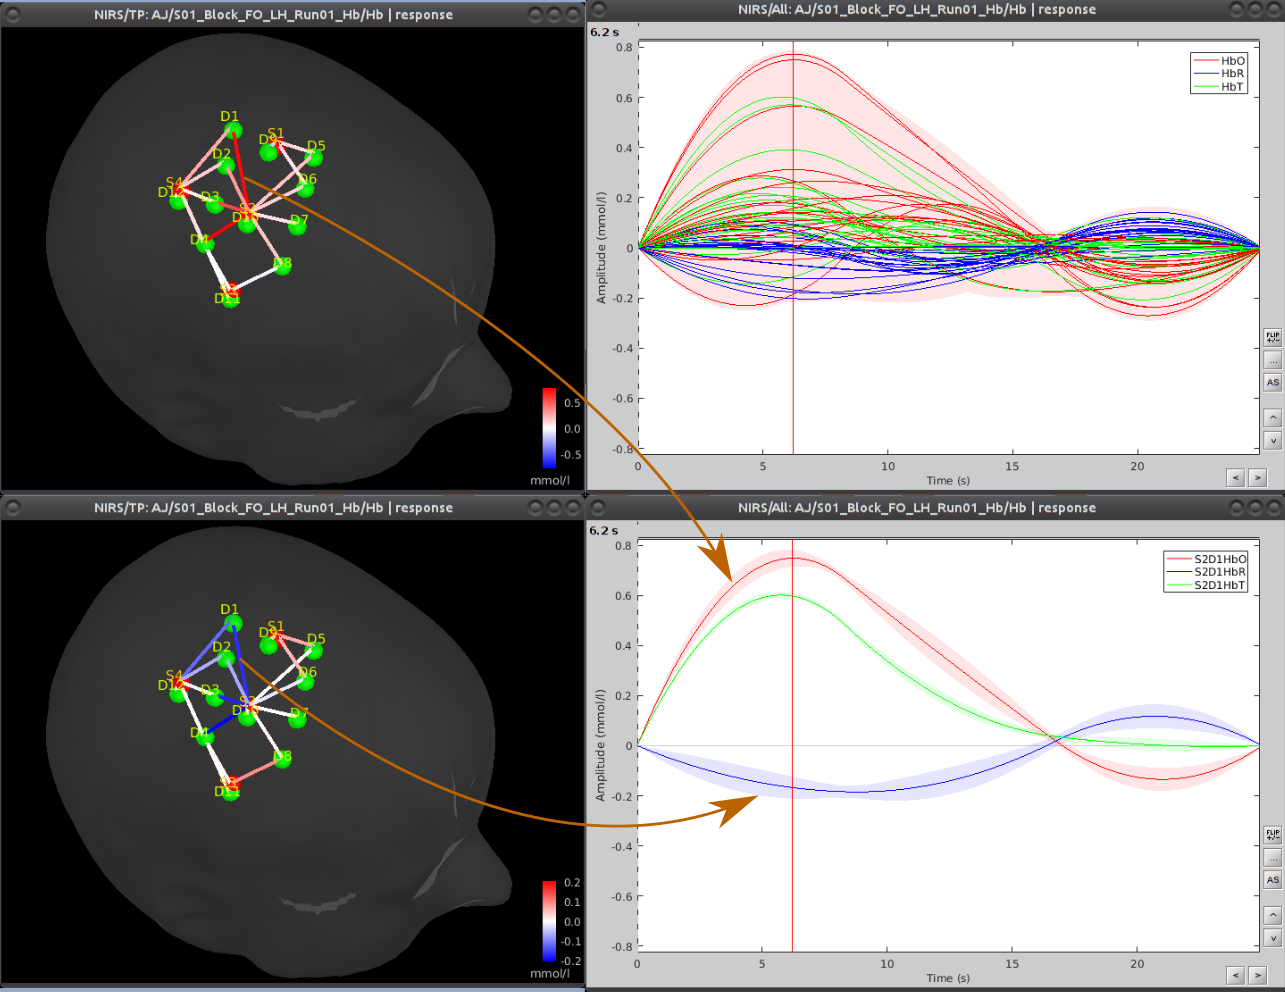 | 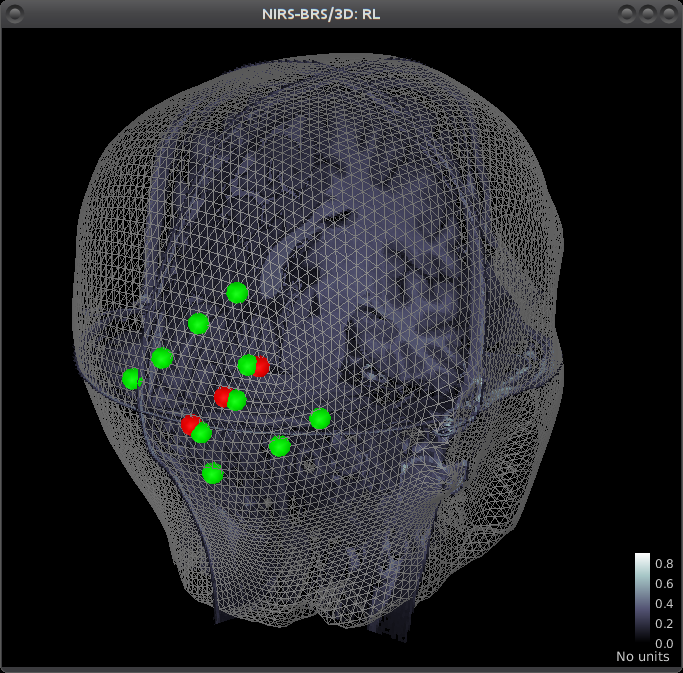 |
| Analysis of functional Near-InfraRed Spectroscopy (fNIRS) data acquired during a motor experiment. fNIRS is a technique that measures brain activity through the absorption of near infrared light by the cerebral hemoglobin (Hb). Hb concentration indeed varies locally when there is local neuronal activity. This is the so-called neuro-vascular coupling. The curves on the right show the variations of concentration of oxy- (red) and deoxy- (blue) hemoglobin evoked by a finger tapping task. On the left part, the amplitudes of these variations are displayed, mapped onto each measurement pair of optodes. | Multimodal view of a NIRS occipital montage. The head mesh segmented from the anatomical MRI is shown as a grey wireframe. Slices of the subject’s anatomy are shown in greyscale. The NIRS optode placement is depicted as spheres, with green ones being detectors and red ones emitters. |
Theme 4: Multimodal functional connectivity (FC) characterizing resting state data in normal and pathological conditions:
While resting state fMRI data have exhibited regions showing distant correlations at low frequency (<0.05Hz) organized as connected networks, the consistent Resting State Networks (RSN), our objective is to combine multimodal data to identify EEG/MEG signatures that would explain such network organization and to characterize pathological networks at the individual level, as potential disease biomarkers.
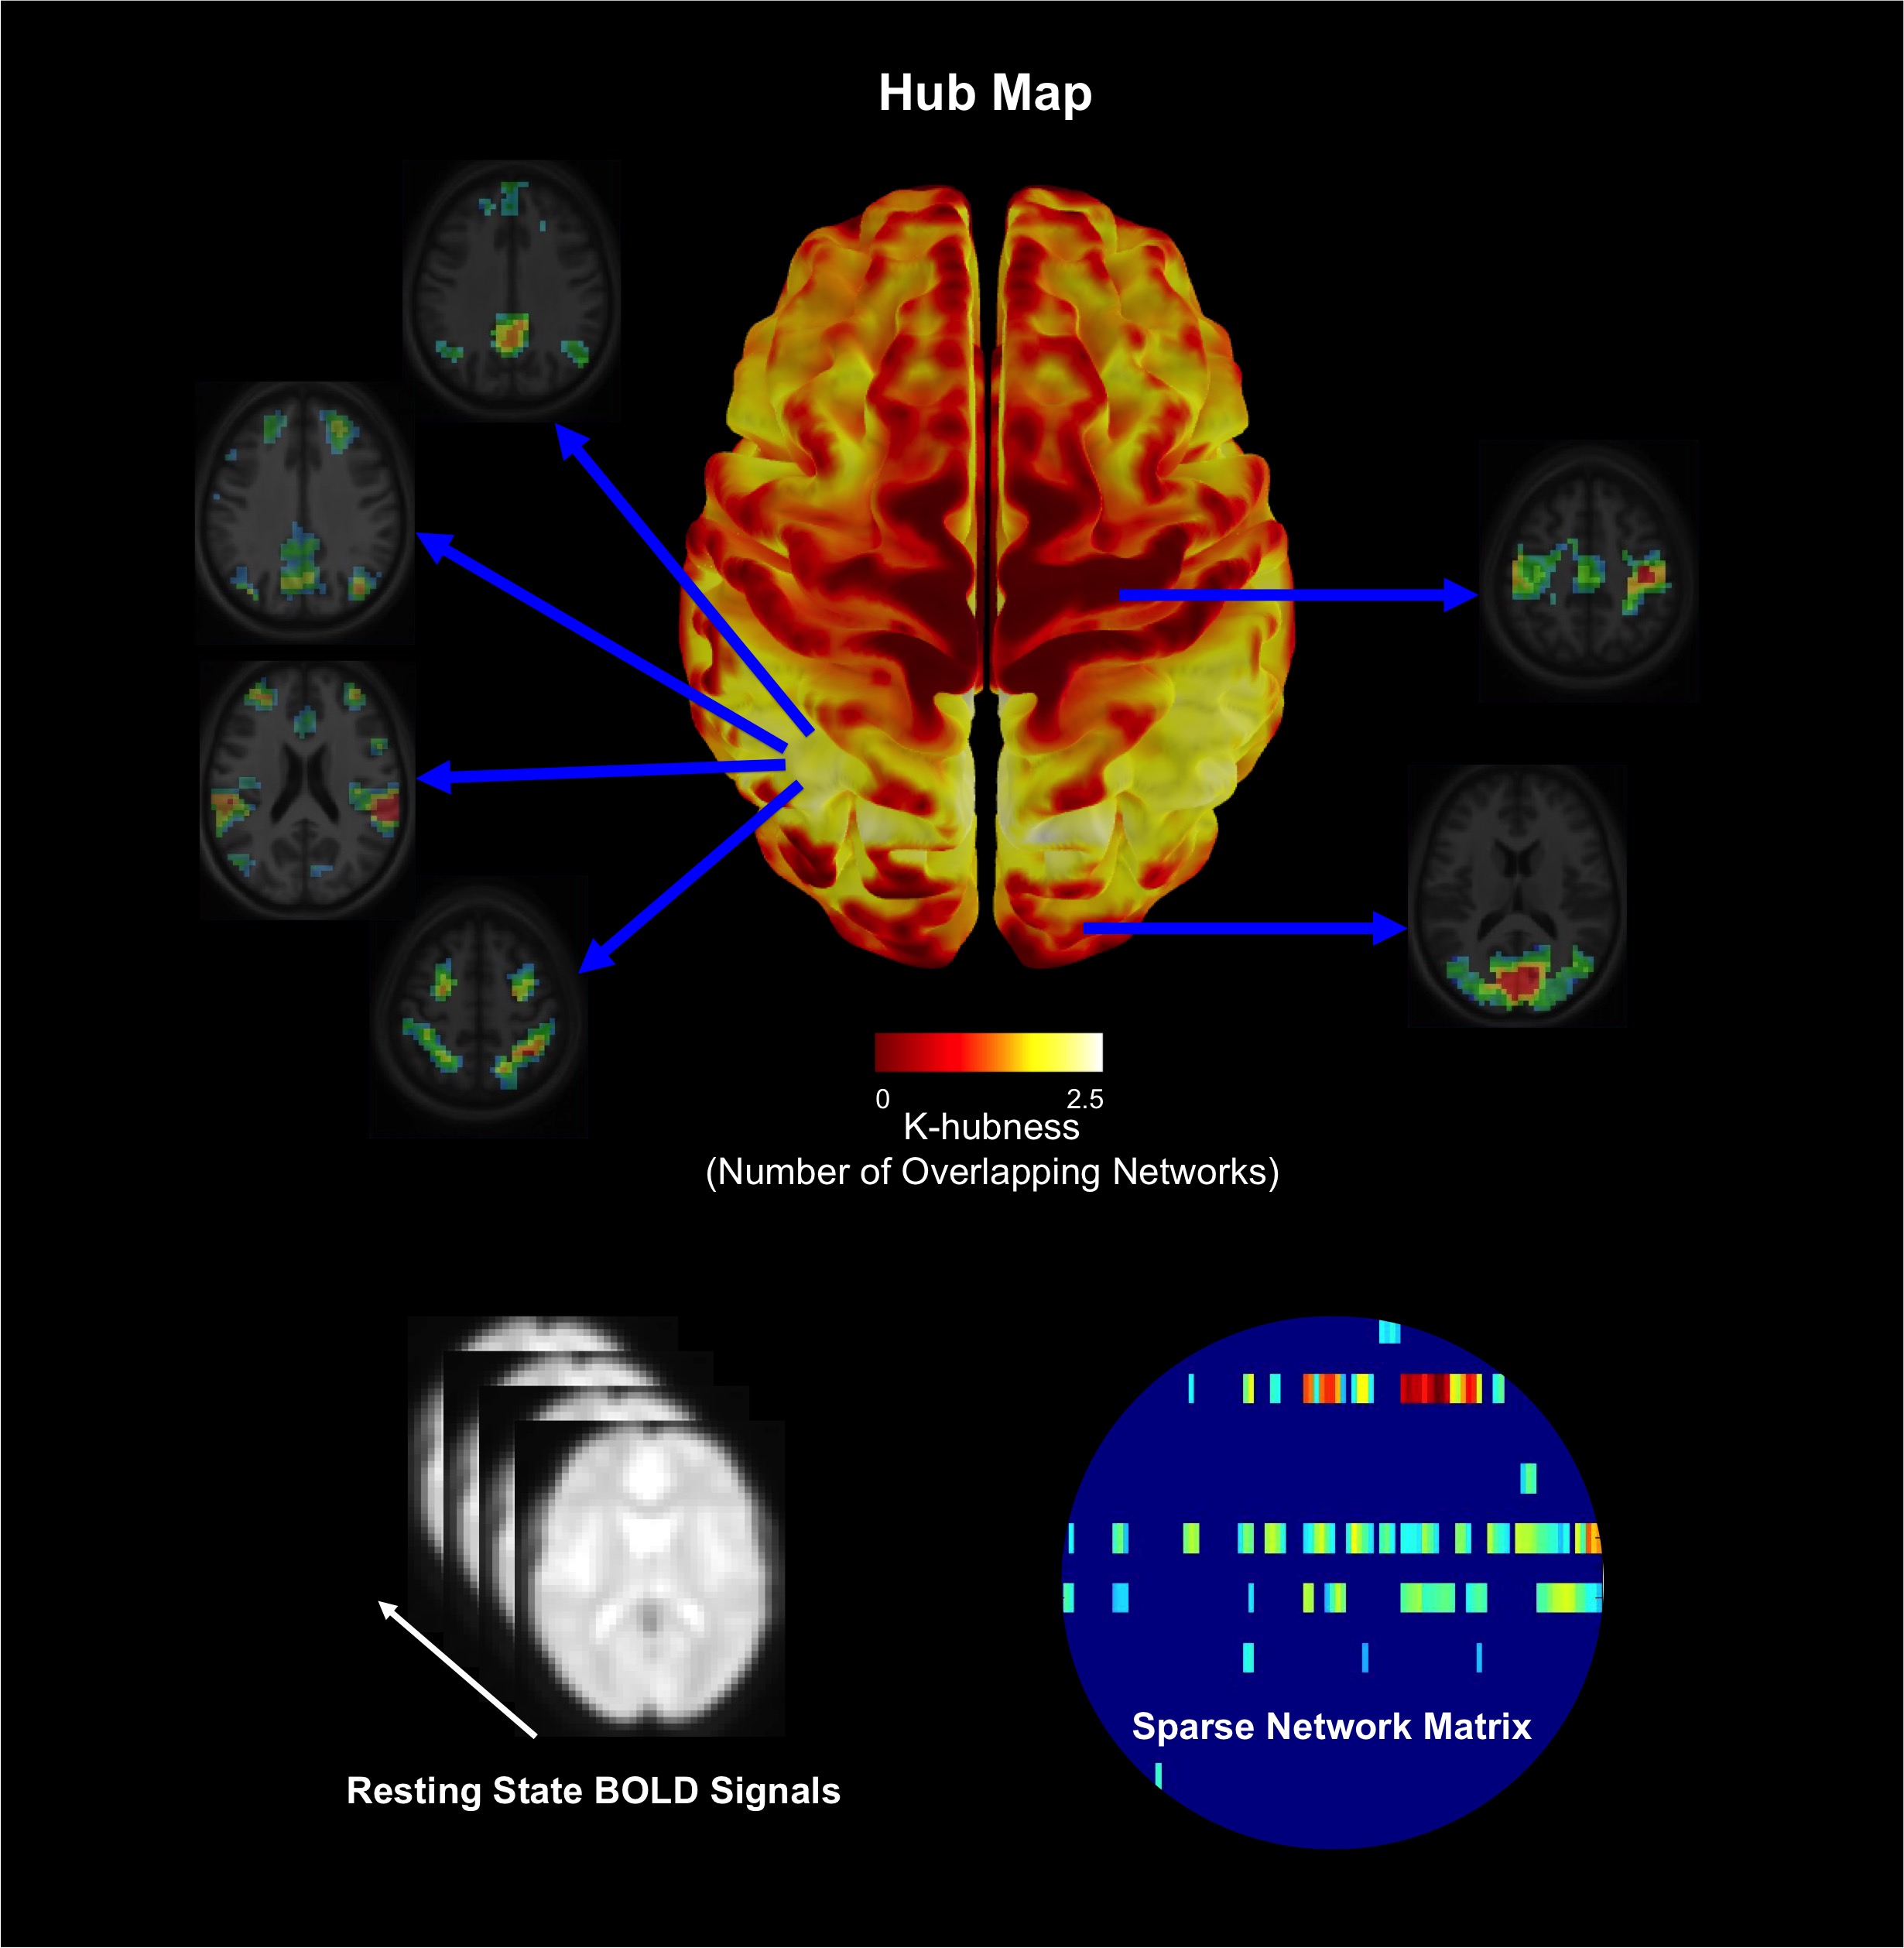 | 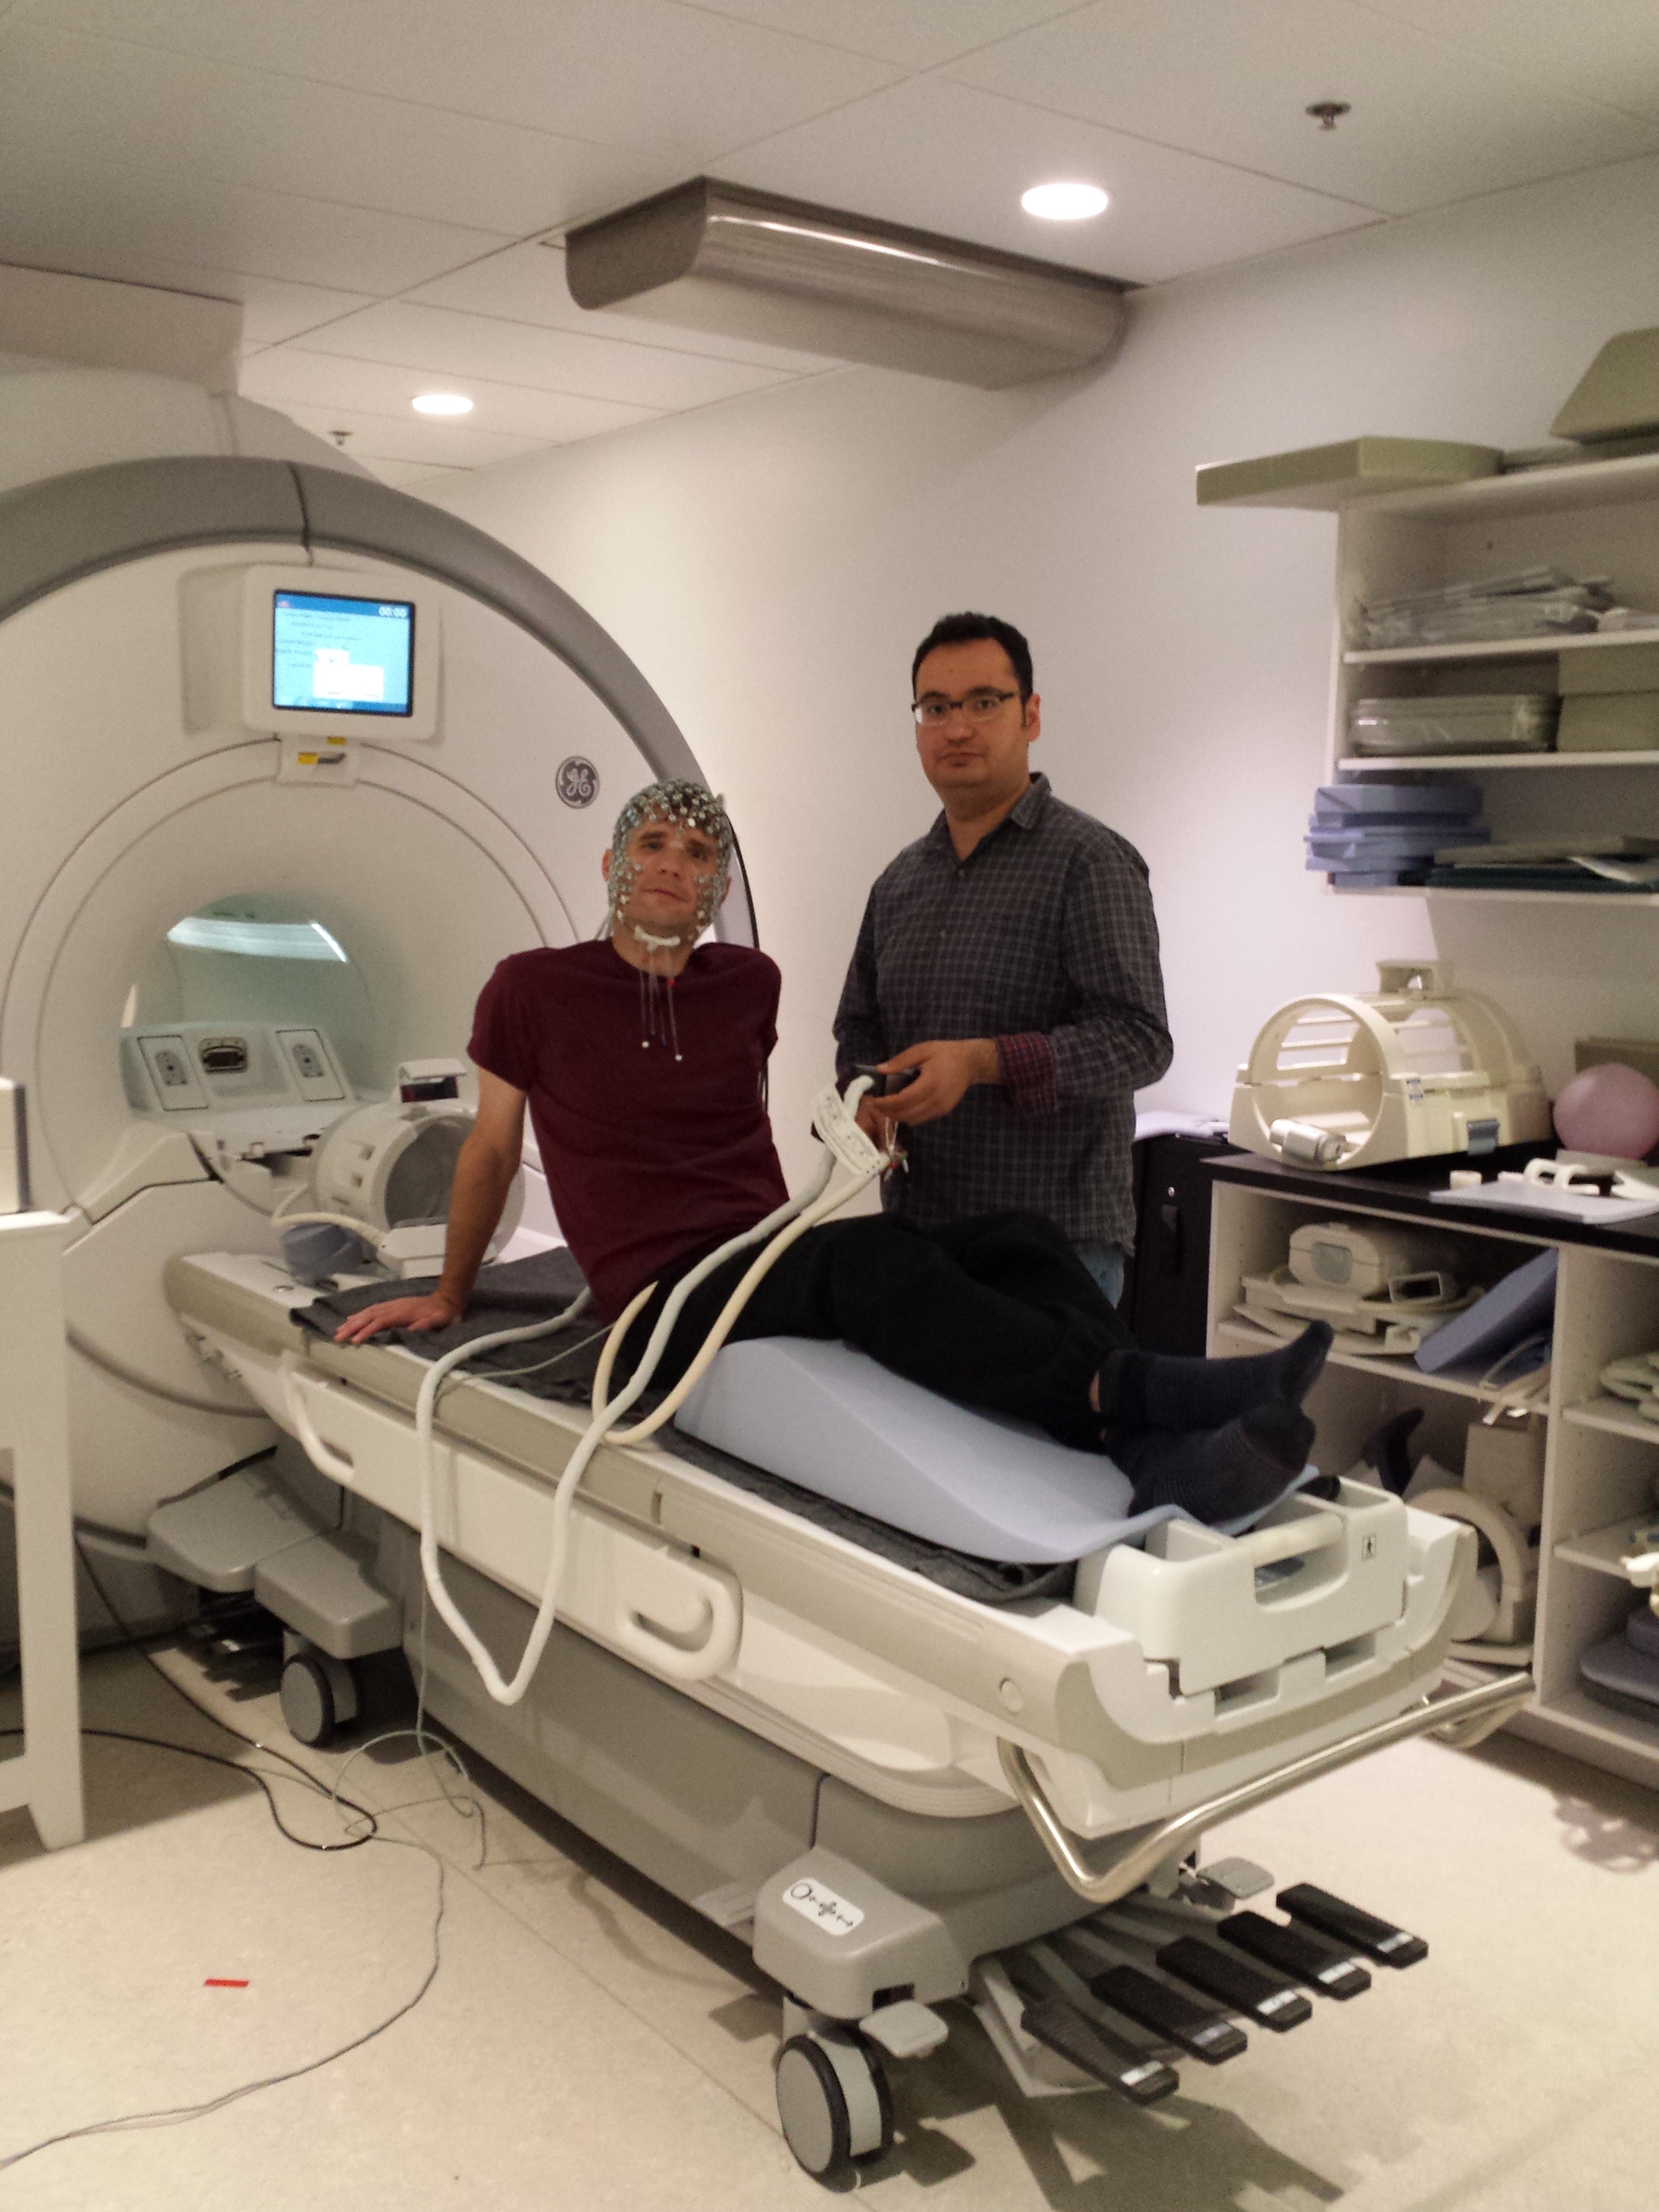 |
| The organization of brain networks can be studied using the blood oxygen-level dependent (BOLD) signals measured using functional magnetic resonance imaging (fMRI) when a subject is not performing an explicit task (resting-state). We proposed a method called SParsity-based Analysis of Reliable K-hubness (SPARK) to model and estimate “hubs” of functional networks by measuring K-hubness in each voxel with good reliability of the estimation at the individual level. Hubs are defined as voxels that are involved in multiple (a sparse number K>1) networks, promoting inter-network connectivity and global communication that are related to higher-level brain functions. | Joint acquisition of electroencephalography (EEG) and functional Magnetic Resonance Imaging (MRI). A high density EEG cap is placed on the participant’s head before he enters the MRI scanner in the back. |